Figure 2.
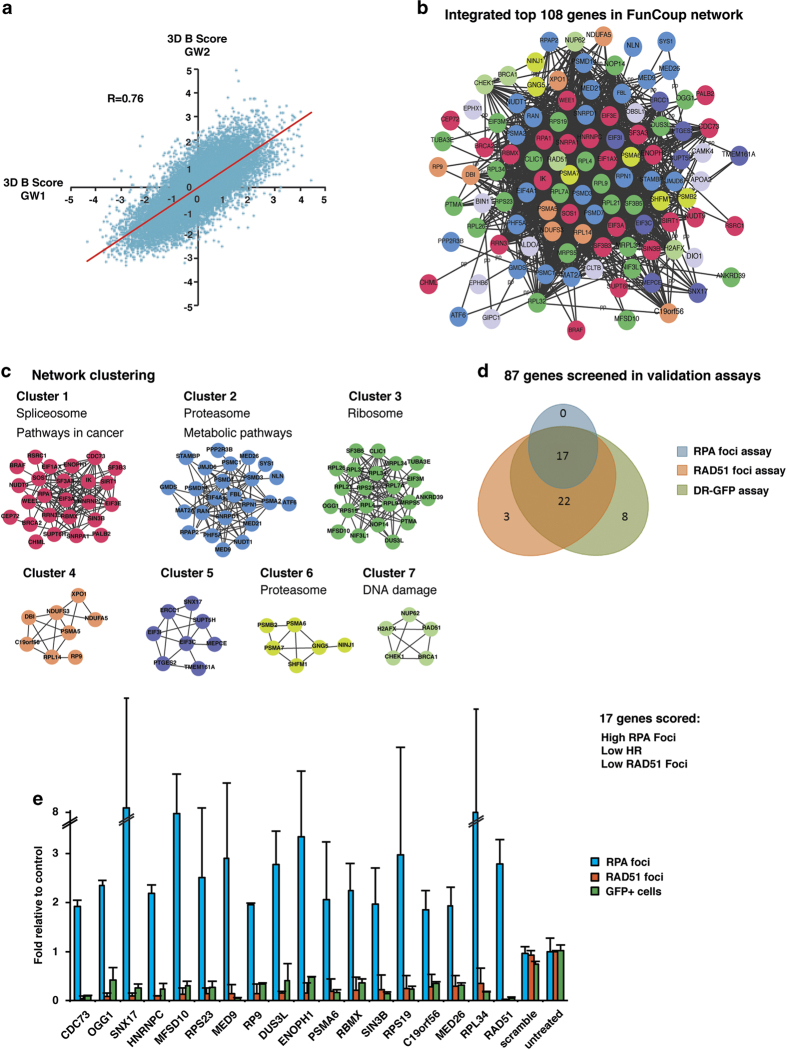
Schematic for how siRNAs were picked for validation. (a) 3D-B scores from the duplicate siRNA screens for RAD51 foci were combined with good correlation (R=0.76). (b) The top 200 candidate genes were mapped to the human FunCoup network resulting in a subnetwork of 108 genes. (c) Network clustering resulted in 7 sub-clusters from which 87 genes were selected for validation assays. The clusters provide more detailed functional annotation, determined by significantly enriched KEGG pathways. (d) Forty-two of the siRNAs that were validated showed significantly lower levels of RAD51 foci compared with control. Of these, 39 also had significantly lower HR-activity in the DR–GFP assay and 17 confirmed an HR-defect in all 3 validation assays (that is, low RAD51 foci levels, increased RPA foci levels and low levels of GFP+ cells in the DR–GFP assay). (e) Results of the 17 siRNAs that had significantly different levels compared with the control in the validation assays. Data showing mean fold values and s.d. from two independent experiments.

