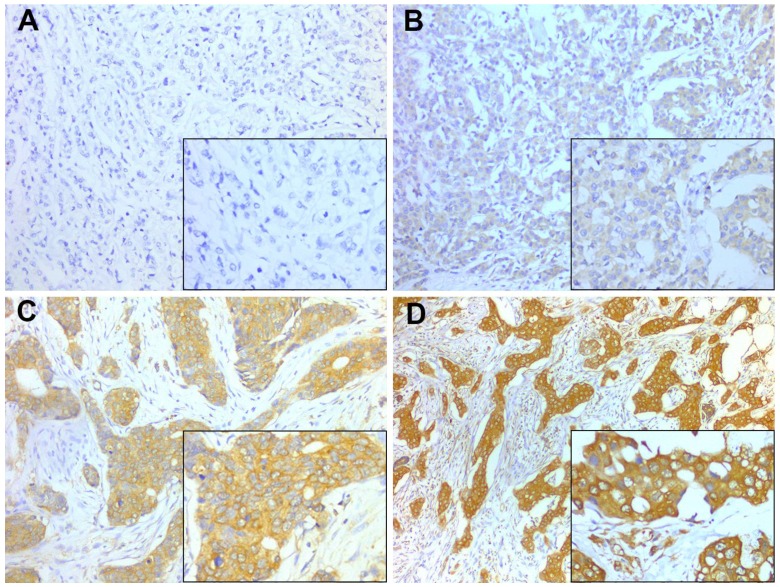
Figure 1.
Representative PD-L1 staining intensities. Staining was localized to the cytoplasm and to the membrane of breast cancer cells. A, Intensity 0, no staining; B, Intensity 1+, weak staining; C, Intensity 2+, moderate staining; D, Intensity 3+, strong staining. A-D, original magnification × 200; inset ×400.

