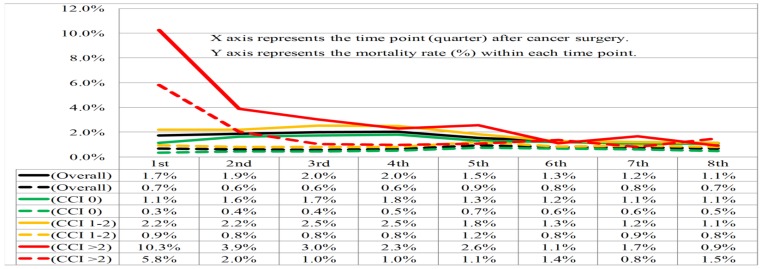
Figure 3.
Cancer-specific (solid line) and noncancer-specific (dashed line) mortality rates within each quarter of the first 2-years after cancer surgery stratified by overall population (black color) and Charlson Comorbidity Index (CCI) subgroups 0 (green color), 1-2 (orange color), and >2 (red color).

