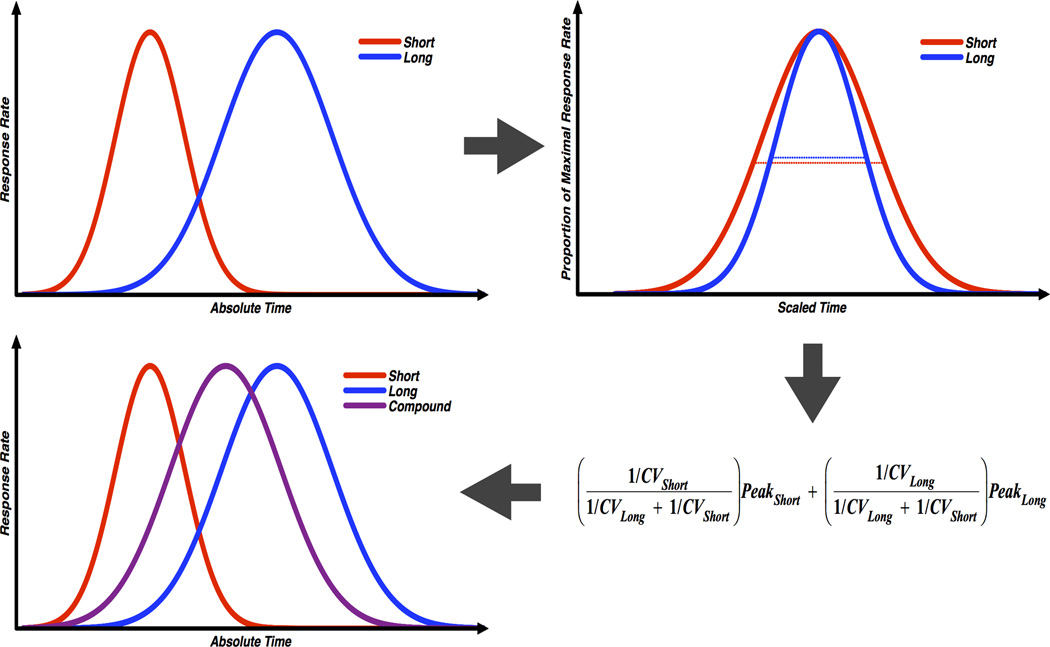
Figure 2.
Schematic of Bayesian weighting during compound trials. Top left: Hypothetical short and long probe trial responding. Top right: Data from the same short and long distributions. However, for each cue, the proportion of maximal response rate across time is expressed as a proportion of the peak time (100% corresponds to the maximums of either function). Plotting the data in this way shows that relative variability in short cue responding is higher than the long cue, despite the fact that the opposite is true in terms of absolute variability. Bottom right: The equation used to compute predicted compound peak times based on the relative variation (CV) in responding to the short and long cue. Bottom left: Same as top left; however, predicted compound responding is now plotted. Note that increased relative variation for the short cue causes the compound function to fall closer to the long duration.

