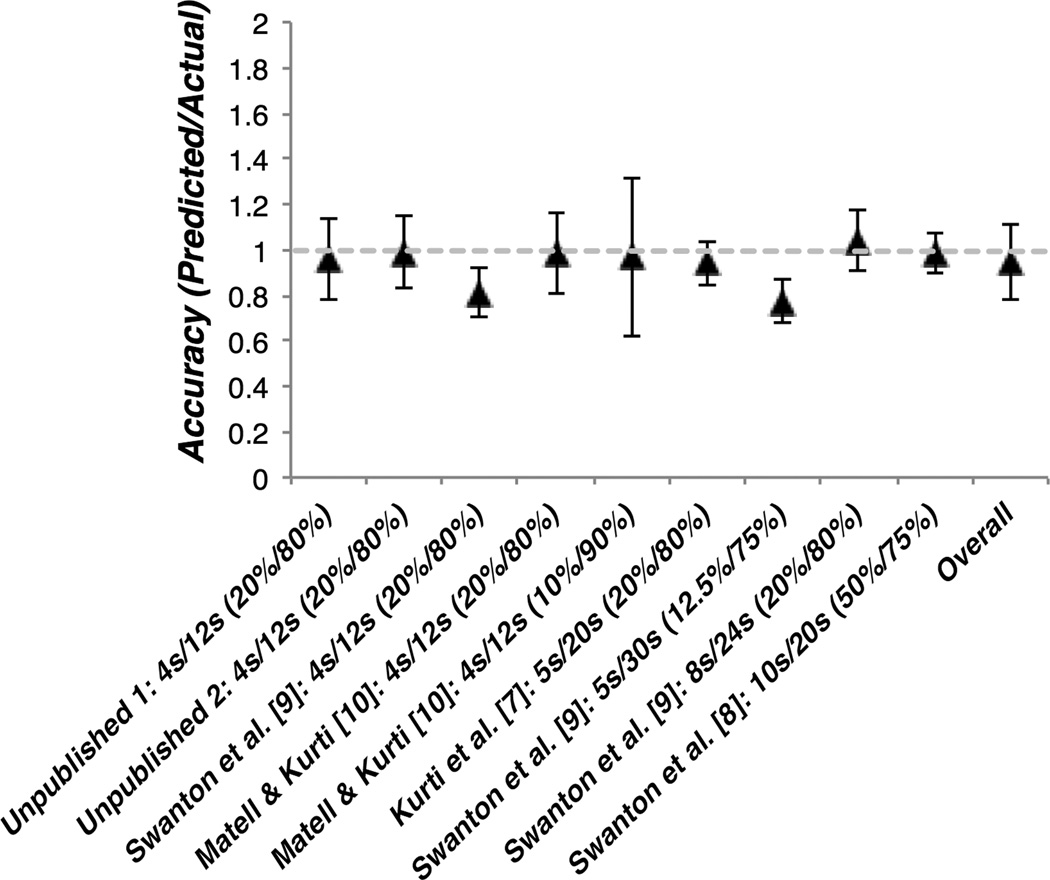
Figure 4.
Average accuracy of Bayesian predictions for rats in each study and across all rats. Accuracy was computed for each rat by dividing the predicted compound peak time by the actual compound peak time. Values of 1 represent perfect accuracy, whereas values above and below 1 correspond to over and under-prediction, respectively. The criterion durations and reinforcement probabilities of the short and long cues are included next to each study citation.

