Figure 4.
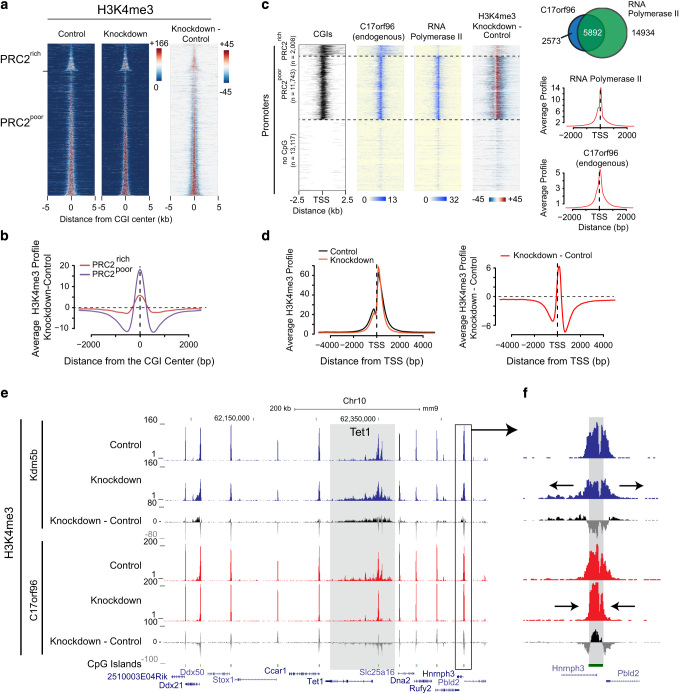
C17orf96 and Kdm5b knockdown affect H3K4me3 distribution oppositely. (a) Heatmaps of H3K4me3 at PRC2-rich and PRC2-poor CGIs as described in Figure 2a. Upon knockdown of C17orf96, H3K4me3 is increased in the core of CGIs but is reduced outside of CGIs. (b) Differential profiles of H3K4me3 knockdown versus control at PRC2-rich and PRC2-poor CGIs. The focusing is stronger at the PRC2-poor CGIs. (c) Heatmaps of C17orf96, RNA polymerase II and H3K4me3 change at gene promoters possessing a PRC2-rich, PRC2-poor or no CGI. At genes with PRC2-poor CGIs, C17orf96 localizes downstream of the transcription start site (TSS) similar to RNA polymerase II (8WG16) [48], which correlates with the strength of H3K4me3 redistribution. The Venn diagram shows the overlap of C17orf96 peaks (overlap from Flag and endogenous ChIP-seq peaks) and RNA polymerase II peaks. The promoter profiles of endogenous C17orf96 and RNA polymerase II show similarity. (d) Profiles of H3K4me3 in C17orf96 control and knockdown cells, showing the redistribution of H3K4me3. The profile of the difference indicates redistribution predominantly downstream of the TSS. (e) Genome browser view showing the comparison of H3K4me3 changes upon knockdown of Kdm5b [26] (blue) or C17orf96 (red). The effects are highly opposite at most CGIs. Strong effects are seen at broad H3K4me3 domains, such as at the Tet1 gene locus (gray box), which are weakly occupied by C17orf96 (Supplementary Figure S6). (f) One example CGI, showing the opposite effects of Kdm5b and C17orf96 knockdown.

