Figure 1.
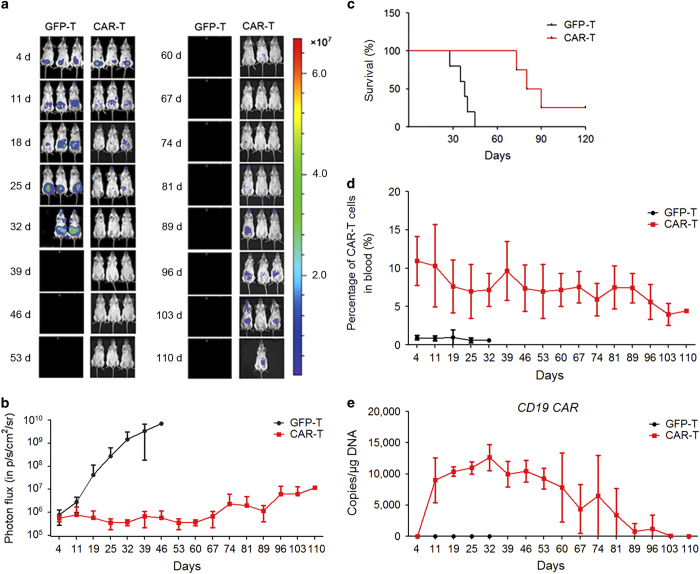
CD19 CAR T cells display significant antitumor activity in an immunodeficient mouse model of CD19+ human Burkitt’s lymphoma cells. (a) Weekly IVIS images of mice to assess the Raji (stably expressing the firefly luciferase fusion protein, Fluc) tumor burden after treatment (GFP-T: n=6, CAR-T: n=6). Raji cells (5×10⁴) expressing the firefly luciferase fusion protein (Fluc) were inoculated i.p. and after 4 days the mice were administered a dose of CAR T cells or GFP T cells (1×10⁶) by i.p. injection. Pseudocolor images show the light intensity and anatomic localization of the Fluc-derived Raji flux signals in three representative mice. The color bar displays the relative Fluc activity in p s−1 cm-2 sr−1. (b) Longitudinal monitoring of the bioluminescent signals of Fluc+ Raji cells in NPG/Vst mice. The y axis indicates the photon flux (p s−1 cm-2 sr−1). (c) Kaplan–Meier survival curve for NPG/Vst mice inoculated with Raji tumor cells after treatment with different T cells. Survival curves for the indicated CAR T cell groups were compared using the log-rank test. The CAR T group shows a significantly increased median survival (log-rank test, P<0.01) compared with the GFP T group. (d, e) Persistence and proliferation of CAR-modified T cells in vivo. Detection of CAR T cells in the blood of Raji-inoculated NPG/Vst mice after weekly T-cell injection using qPCR and flow cytometry. A total of 100 μl of venous blood was drawn weekly from orbital venous plexus of each mouse, and 50 μl of venous blood was lysed using FACS Lysing Solution. The CD19 CAR T cells were detected using a CD19 CAR-specific monoclonal antibody and flow cytometry. Another 50 μl aliquot of the venous blood was used to detect the copy numbers of CAR per microgram genomic DNA using qPCR.

