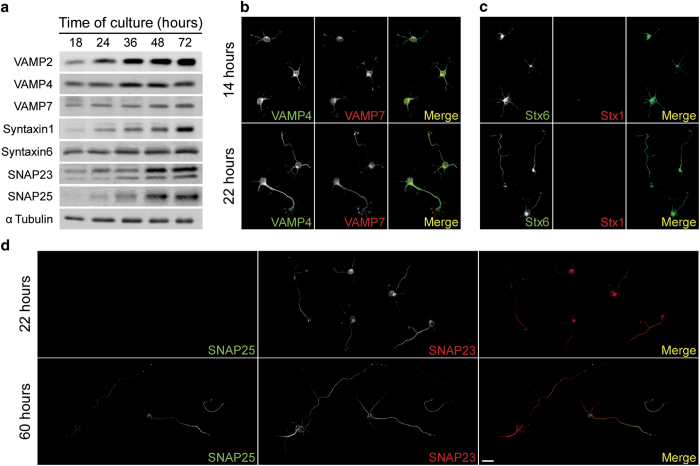
Figure 1.
(a) Western blot showing the expression of VAMP2 (first row; apparent molecular weight 18 kDa), VAMP4 (second row; apparent molecular weight 16 kDa), VAMP7 (third row; apparent molecular weight 24 kDa), Syntaxin1 (fourth row; apparent molecular weight 34 kDa), Syntaxin6 (fifth row; apparent molecular weight 31 kDa), SNAP23 (sixth row; apparent molecular weight 23 kDa) and SNAP25 (seventh row; apparent molecular weight 25 kDa),) in hippocampal pyramidal neurons after 18, 24, 36, 48 or 72 h of DIV. Tubulin was used as a loading control. A particularity of SNAP23 was that, besides the expected band (apparent molecular weight 23 kDa) a less intense, lower band was observed. This is probably not due to nonspecific labeling since this band was observed in neurons in culture, but not always in brain preparations. This double-band pattern has been previously described and may represent cleavage products, alternative splicing, post-translational modifications [55] or SNAP23 isoforms [56]. (b) Double immunofluorescence micrographs showing the distribution of VAMP4 (green) and VAMP7 (red) in hippocampal pyramidal neurons in culture after 14 (top) or 22 (bottom) h of DIV. (c) Double immunofluorescence micrographs showing the distribution of Syntaxin6 (green) and Syntaxin1 (red) in hippocampal pyramidal neurons in culture after 14 (top) or 22 (bottom) h of DIV. (d) Double immunofluorescence micrographs showing the distribution of SNAP25 (green) and SNAP23 (red) in hippocampal pyramidal neurons in culture after 22 (top) or 60 (bottom) h of DIV. Calibration bar= 20 μm.

