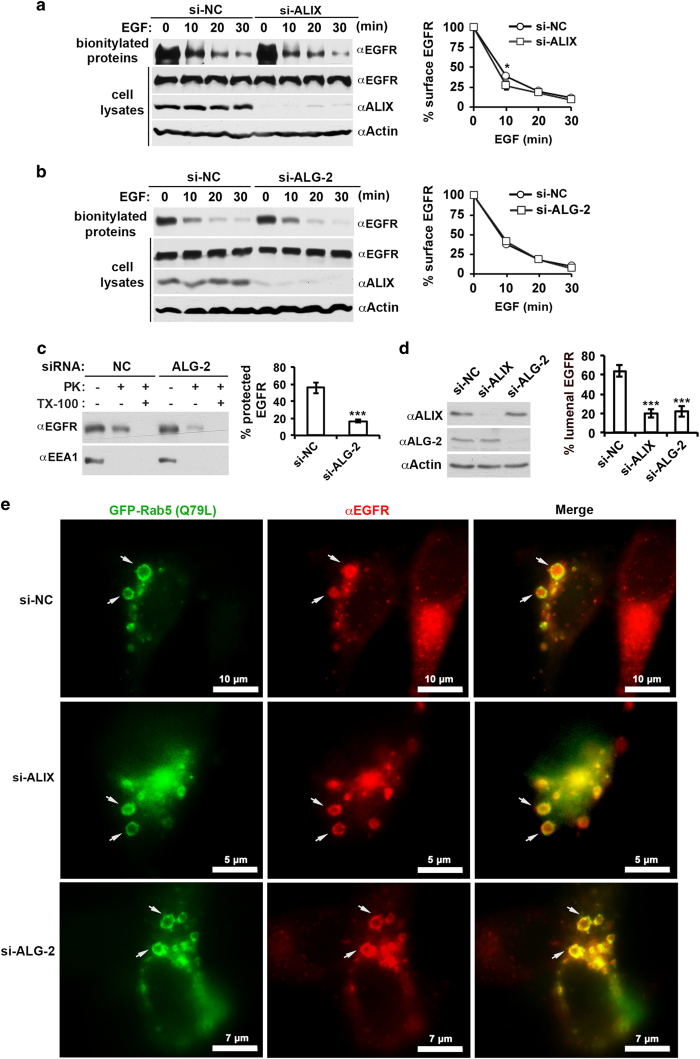
Figure 6.
ALG-2 activates the MVB sorting function of ALIX at early endosomes. (a) HEK293 cells were transfected with si-NC or si-ALIX(1+2) and cultured for 48 h. After serum starvation for 12 h, cells were stimulated with EGF for indicated minutes and biotinylated. Cell lysates prepared from these cells were incubated with streptavidin beads, and input and bound proteins were immunoblotted with indicated antibodies to visualize EGFR, ALIX, and actin (left panel). The average percentages of cell surface EGFR at different time points and s.d. were determined from three independent experiments and plotted (right panel). (b) HEK293 cells were transfected with si-NC or si-ALG-2(1+2) and processed as described in a (left panel). The average percentages of cell surface EGFR at different time points and s.d. were determined from three independent experiments and plotted (right panel). (c) HEK293 cells were transfected with si-NC or si-ALG-2(1+2) and assayed for EGF-stimulated MVB sorting of EGFR as described in Figure 5a, except that cells were cultured in the presence of 10 μm nocodazole for 2 h before and during EGF stimulation (left panel). The average percentages of protected EGFR and s.d. were determined from three independent experiments and plotted (right panel). (d) HeLa cells were first transfected with si-NC, si-ALIX (1+2), or si-ALG-2(1+2) and cultured for 24 h. These cells were then transfected with the expression plasmids for GFP-Rab5 (Q79L) and cultured for another 12 h before serum starvation for 12 h. Lysates of these cells were immunoblotted with indicated antibodies to visualize ALIX, ALG-2, and actin (left panel). These cells were also stimulated with EGF for 30 min, immunostained with an anti-EGFR antibody (red), and observed under a fluorescence microscope. Total and luminal EGFR were quantified for 10 readily discernible GFP-Rab5 (Q79L)-labeled endosomes for each cell condition, and the percentages of luminal EGFR were calculated. The average percentages of luminal EGFR and s.d. were determined from three independent experiments and plotted (right panel). (e) Representative images from the experiments described in d are shown. Arrows indicate typical GFP-labeled enlarged endosomes with EGFR staining for each cell condition. Note that images of the middle panel and lower panel are magnified for clear visualization of individual endosomes and that scale bars are labeled accordingly. ALG-2, apoptosis-linked gene-2 product; EGF, epidermal growth factor; EGFR, epidermal growth factor receptor; GFP, green fluorescent protein; MVB, multivesicular body; si-NC, negative-control small interfering RNA.

