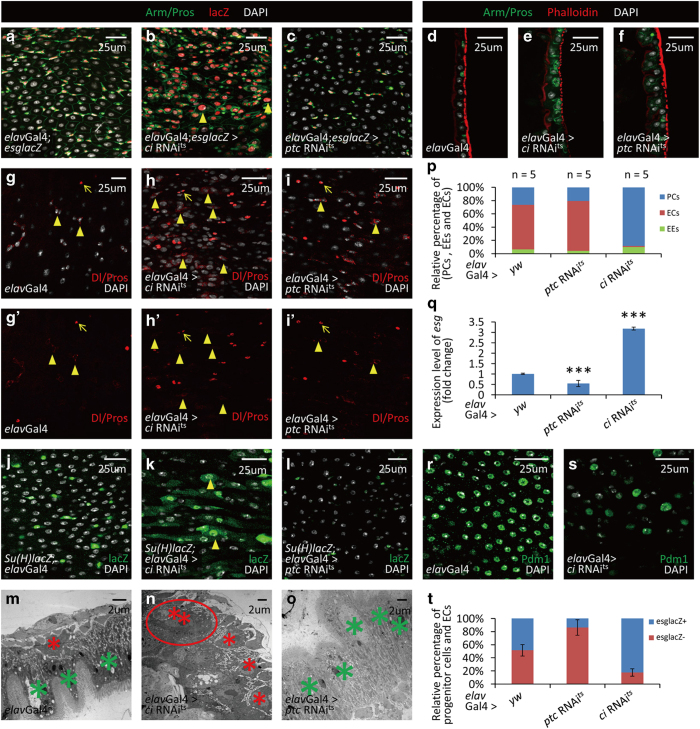
Figure 3.
Neuronal Hh signaling is essential for the posterior intestinal homeostasis in Drosophila. (a–c) Cross-section and (d–f) longitudinal section immunostaining of intestinal progenitor cells (Arm+/Pros−: green staining in cytoplasm without green staining in nucleus; esglacZ+: red), EEs (Arm+/Pros+: green staining in cytoplasm, along with strong green staining in nucleus) and ECs (big nuclei). Intestines were taken from control flies (a, d), neuron-specific ci RNAi flies (b and e) and neuron-specific ptc RNAi flies (c and f). Neuron-specific Hh suppression (ci RNAi, b, e) causes an accumulation of intestine progenitor cells and a reduction of ECs. There are some intestinal progenitor cells with large nuclei (arrowheads in b). Neuron-specific Hh activation (ptc RNAi, c, f) causes a reduction of intestinal progenitor cells and an increase of ECs. (g–i′) Immunostaining of ISCs (arrowheads; Delta+: red staining in cytoplasm) and EEs (arrows; Pros+: red staining in nucleus) in control (g, g′), neuron-specific ci RNAi (h, h′) and neuron-specific ptc RNAi (i, i′) flies. Overexpression of ci RNAi in neurons induces an increase of ISCs, while overexpression of ptc RNAi in neurons does not influence the number of ISCs. (j–l) Immunostaining of EBs (Gbe-Su(H)-lacZ+: red) in intestines of control (j), neuron-specific ci RNAi (k) and neuron-specific ptc RNAi (l) flies. Overexpression of ci RNAi in neurons induces an accumulation of EBs and some of them showed large nuclei (arrowheads, k). Overexpression of ptc RNAi in neurons causes a noticeable reduction of EBs (l). (m–o) TEM images of intestines from control (m), neuron-specific ci RNAi (n) and neuron-specific ptc RNAi (o) flies. Intestinal progenitor cells are small cells located near the base membrane (marked with red asterisk). ECs are big cells with villi (marked with green asterisk). Neuron-specific Hh suppression causes an accumulation of intestinal progenitor cells and some of them form a cluster as same as that induced by neuron ablation (red circle). Neuron-specific Hh activation causes an increase of ECs. (p) Quantitative analysis of relative percentage of EEs, ECs and intestinal progenitor cells (PCs) per microscopic field (enlargement factor 10×40) in control, neuron-specific ci RNAi and neuron-specific ptc RNAi flies. (q) Quantitative PCR analysis of intestine progenitor-specific marker esg under indicated experimental conditions. The depicted data are mean±s.d. from three independent experiments. In every experiment, at least 10 intestines were pooled together, ***P<0.005. (r and s) Shown in (r) are immunostaining of ECs from intestines of control flies. ECs (Pdm1+: green) are reduced after neuron-specific Hh suppression (s). (t) Statistic results of BrdU tracing experiments in fly intestine. After ptc RNAi expression in neurons, the most of BrdU-labeled cells are ECs (esglacZ−; big nuclei. See Supplementary Figures S5B–B′′). After ci RNAi expression in neurons, the most of BrdU-labeled cells are intestinal progenitor cells (esglaZ+. See Supplementary Figures S5C–C′′). The results showed here are data averaged from two independent experiments. In every experiment, at least 20 intestines were covered. See also Supplementary Figures S4–7.

