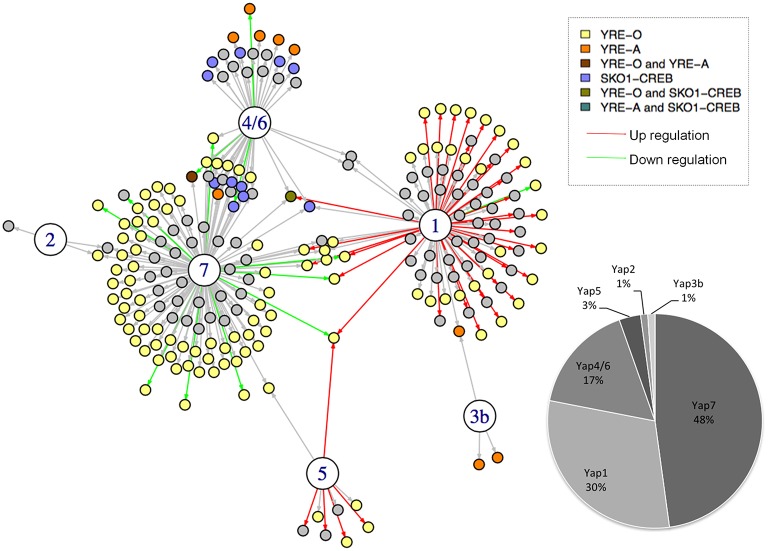
Figure 1.
The Yap network of Candida glabrata. The large circles represent the CgYap transcription factors (1 = CgYap1; 2 = CgYap2, etc.) and the small circles are the potential targets. An arrow indicates a potential regulatory interaction based on ChIP-seq. The color of the arrow indicates the directionality of the potential regulation based on transcriptome data (red, positive regulation; green, negative regulation; black, no change detected). The color of the targets indicates the consensus DNA sequences detected in the ChIP-peaks (see color code on the upper right). The percentage of targets for each CgYap is indicated on the bottom right. This network was represented using I-GRAPH and the information from Supplementary Table 1.

