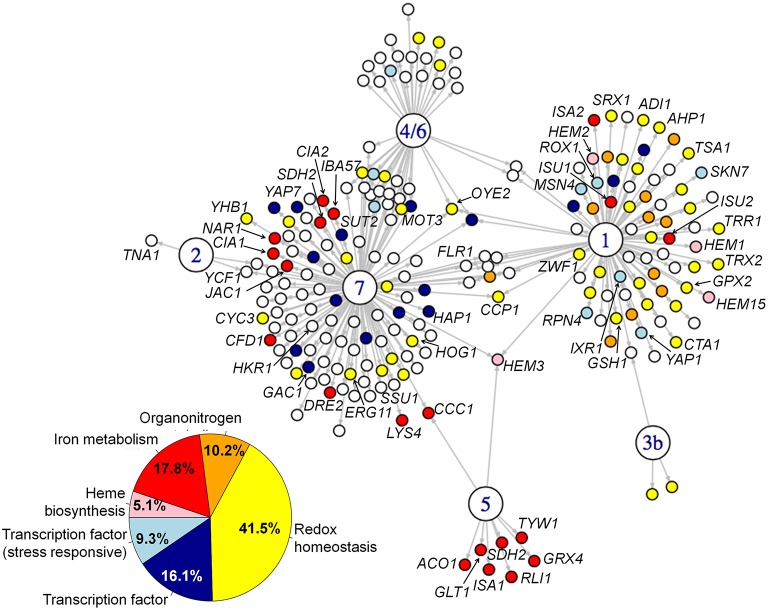
Figure 3.
Functional annotation of the CgYap network. Gene ontology analyses were performed on the target sets of the CgYap network. The main enriched categories are represented here by the colors of the corresponding targets (color code on the bottom left). “Oxido-reduction” corresponds to the GO categories “oxidation-reduction process,” “response to oxidative stress,” and “oxidoreductase activity.” “Transcription factor” corresponds to the GO category “sequence-specific DNA binding.” “transcription factor (stress responsive)” corresponds to the GO category “regulation of transcription from RNA polymerase II promoter in response to stress.” “Heme biosynthesis” corresponds to the GO category “heme biosynthetic process.” “iron metabolism” corresponds to the GO categories “iron-sulfur cluster assembly,” “iron-sulfur cluster binding” and “iron ion homeostasis.” “Organitrogen” corresponds to the GO category “organonitrogen compound metabolic process.” The complete GO results are available in Supplementary Table 1. The names of the genes which are discussed in the main text are indicated. The phenotypes of the CgYAP mutant strains in various stress conditions are shown in Supplementary File S10.

