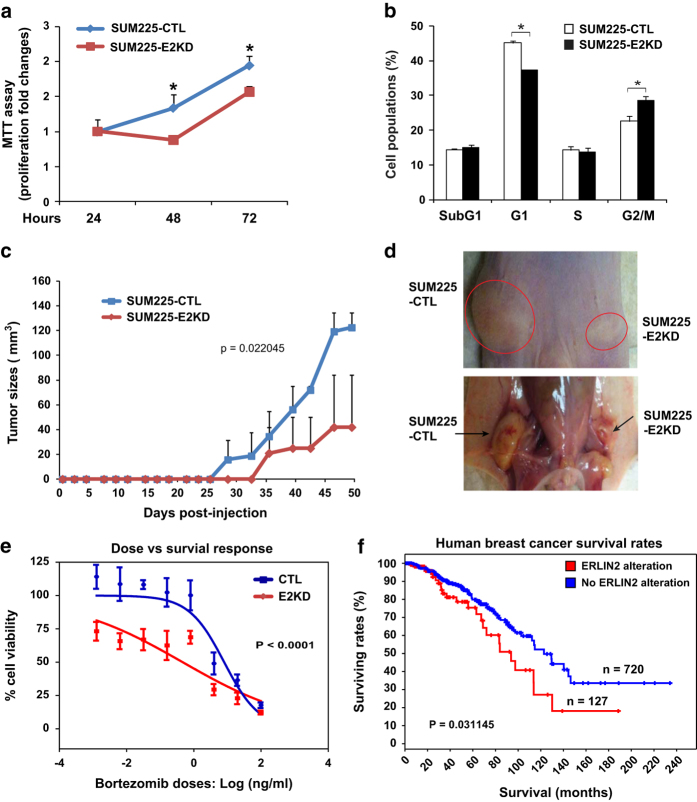
Figure 7.
Knockdown of endoplasmic reticulum lipid raft-associated protein 2 (ERLIN2) represses human breast cancer cell proliferation and malignancy in vivo. (a) Cell proliferation assay (MTT) of ERLIN2-knockdown (E2KD) and control (CTL) SUM225 cells. The same numbers of ERLIN2-knockdown and nonsilence control SUM225 (~5 000 cells per well) were seeded. The assay was performed with the cells after 24, 48, and 72 h of culture. The error bars denote the standard deviation (n=4 biological repeats). (b) Cell cycle flow cytometry analysis (FACS) assay of ERLIN2-knockdown and control SUM225 cells after 6 days of culture. VybrantDyeCycle Orange Stain was used to stain live cell DNA content. The trypsinized cells were stained and subjected to a fluorescence-activated cell sorter to quantify cell populations in different cell cycle phases. (c) Growth rates of ERLIN2-knockdown and control human breast cancer tumors in the xenograft nude mice. The same numbers of ERLIN2-knockdown and control human breast cancer SUM225 cells were orthotopically transplanted into the mammary fat pads of the left and right flanks of nude mice. Tumor growth (sizes) were monitored every 3 days. Mice were euthanized at 7 weeks after injection. (d) Appearance of ERLIN2-knockdown and control breast tumors developed in the nude mice at 7 weeks after the implantation. (e) SUM225 cell dose–response to Bortezomib treatment. ERLIN2-knockdown and control SUM225 cells were treated with Bortezomib at the concentrration ranging from 0.00128, 0.0064, 0.032, 0.16, 0.8, 4, 20, to 100 ng ml−1 (serial 5:1 dilutions) for 72 h. After the incubation period, MTT assay was performed to determine cell viability. Each treatment point was performed in quadruplicate and the cell survival dose–response curves were generated through nonlinear regression based on log(dose) vs cell viability response (variable slope). The IC50 (inhibitory concentration of Bortezomib with 50% cell viability) values are 8.027 for the control cells and 0.4675 for the ERLIN2-knockdown cells. Two-way analysis of variance (ANOVA) grouped analysis P<0.0001. (f) Survival rates of human breast cancer patients with or without ERLIN2 gene alteration. In 959 all complete primary breast cancer cases provided by TCGA Cancer Genomic database (http://www.cbioportal.org), 14.7% cases displayed ERLIN2 gene alteration. Excluding 107 cases deceased, the survival rates of the cases with ERLIN2 gene alteration (n=127) were significantly lower than those without ERLIN2 gene alteration (n=720), based on overall survival Kaplan–Meier Estimate. The P-values were calculated by Log rank Test.

