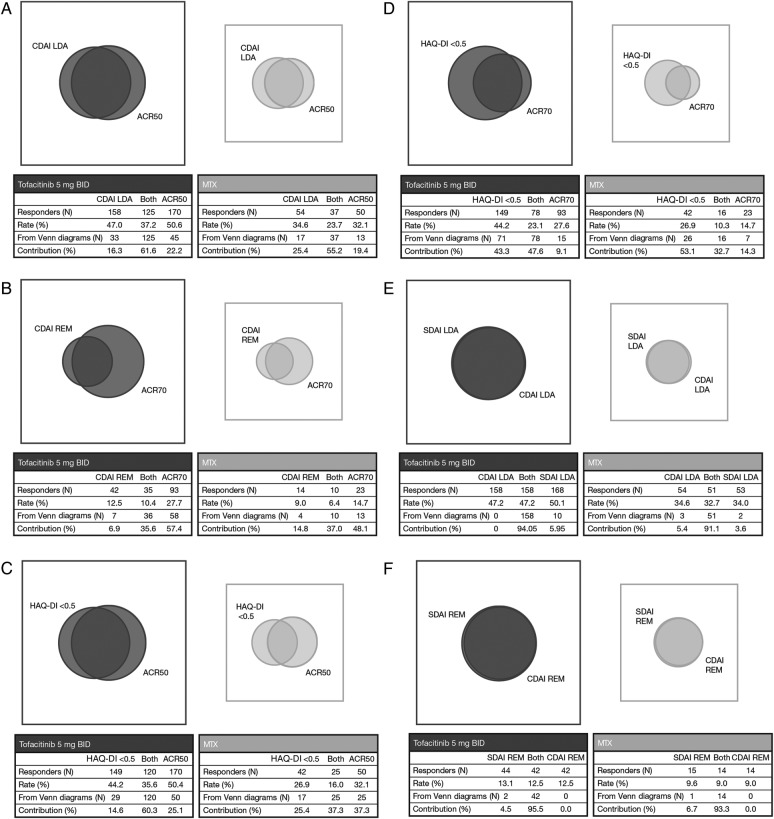
Figure 4.
Venn diagram showing overlap of responses in patients treated with tofacitinib 5 mg BID and MTX for (A) CDAI LDA and ACR50; (B) CDAI REM and ACR70; (C) HAQ-DI <0.5 and ACR50; (D) HAQ-DI <0.5 and ACR70; (E) SDAI LDA and CDAI LDA and (F) SDAI REM and CDAI REM. The more the two circles of the Venn diagram overlap, the higher the concordance. Relative sizes of the Venn diagrams for tofacitinib 5 mg BID and MTX approximately reflect the smaller sample size of the MTX group. To be included in a Venn diagram, a patient must have non-missing values for both outcomes. The rows labelled Responders (N) represent the number of patients responsive for the first outcome, both outcomes and the second outcome, respectively. Rate (%), represents the overall response rate to the first outcome, both outcomes and the second outcome, respectively. The rows labelled From Venn diagrams (N) respresent the number of patients only responsive to the first outcome, both outcomes and only the second outcome, respectively; they sum to the number of patients who responded to at least one of the end points. Contribution (%) represents the proportional size of the contribution of the total number of patients who responded to only the first outcome, both outcomes and only the second outcome, respectively. ACR, American College of Rheumatology; BID, twice daily; CDAI, Clinical Disease Activity Index; HAQ-DI, Health Assessment Questionnaire-Disability Index; LDA, low disease activity; MTX, methotrexate; REM, remission; SDAI, Simplified Disease Activity Index.

