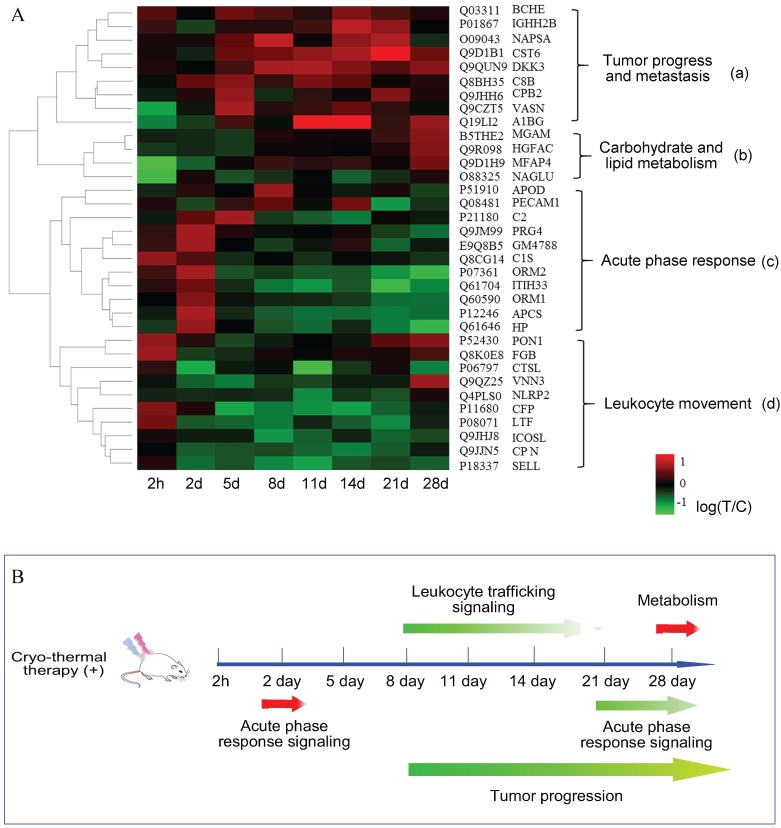
Figure 4.
Quantitative time course measurement of induced proteome changes. (A) The unsupervised hierarchical clustering of significant proteins' changes over time course. The dendrogram generated represents the clustering of proteins (a-d). Biological process enrichment is based on IPA functional annotation. (B) The schematic graph of systematic response regulated in a time resolved pattern. Arrows in red represented proteins up-regulated, while in green are proteins down-regulated or in dysregulation.

