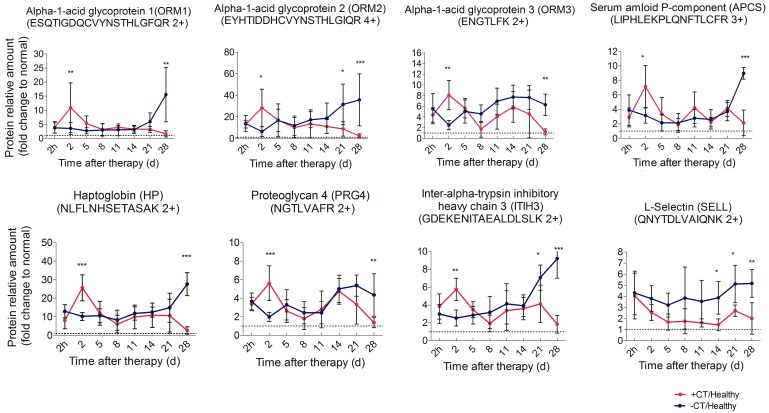
Figure 5.
Time course verification of proteins associated with acute phase response and leukocyte activity using parallel reaction monitoring. Individual peptide's abundance was used as a proxy of protein's abundance. Peptide's abundance in mice treated and untreated was divided by its corresponding partner in healthy mice and plot over time. The dash line represents the protein expression level in healthy mice. Data are shown as mean ± SD. *p < 0.05, **p < 0.01, ***p < 0.001 by two-way ANOVA with the Bonferroni correction. n=5~6 for each condition, except that on the 28th day, only 3 mice left in the control group.

