. 2016 Jan-Apr;20(1):16–19. doi: 10.4103/0973-029X.180907
Copyright: © 2016 Journal of Oral and Maxillofacial Pathology
This is an open access article distributed under the terms of the Creative Commons Attribution-NonCommercial-ShareAlike 3.0 License, which allows others to remix, tweak, and build upon the work non-commercially, as long as the author is credited and the new creations are licensed under the identical terms.
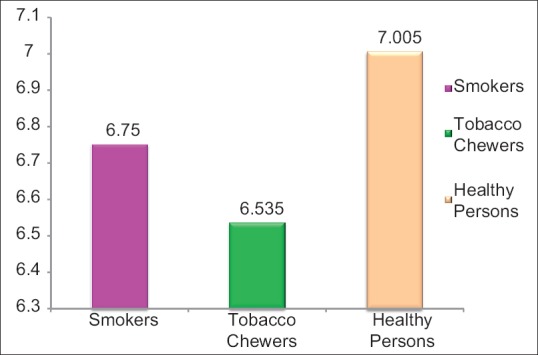
Figure 3.

Graph showing average pH scores of saliva in three groups
