
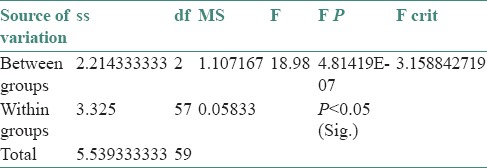
Table 3.
One way ANOVA F-table for comparing the pH scores of saliva among three groups
Official websites use .gov
A
.gov website belongs to an official
government organization in the United States.
Secure .gov websites use HTTPS
A lock (
) or https:// means you've safely
connected to the .gov website. Share sensitive
information only on official, secure websites.
One way ANOVA F-table for comparing the pH scores of saliva among three groups