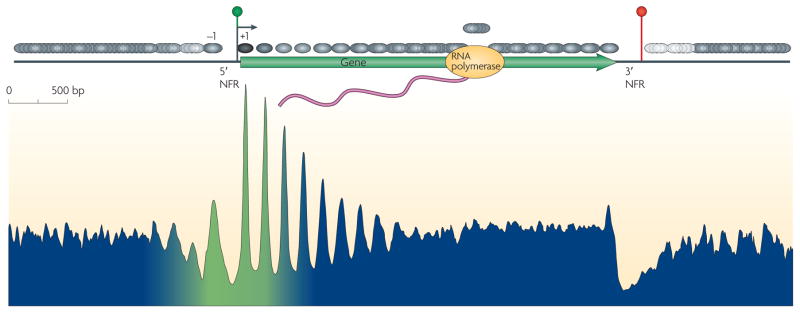
Figure 2. Nucleosomal landscape of yeast genes.
The consensus distribution of nucleosomes (grey ovals) around all yeast genes is shown, aligned by the beginning and end of every gene. The resulting two plots were fused in the genic region. The peaks and valleys represent similar positioning relative to the transcription start site (TSS). The arrow under the green circle near the 5′ nucleosome-free region (NFR) represents the TSS. The green –blue shading in the plot represents the transitions observed in nucleosome composition and phasing (green represents high H2A.Z levels, acetylation, H3K4 methylation and phasing, whereas blue represents low levels of these modifications). The red circle indicates transcriptional termination within the 3′ NFR. Figure is reproduced, with permission, from REF. 20 © (2008) Cold Spring Harbor Laboratory Press.

