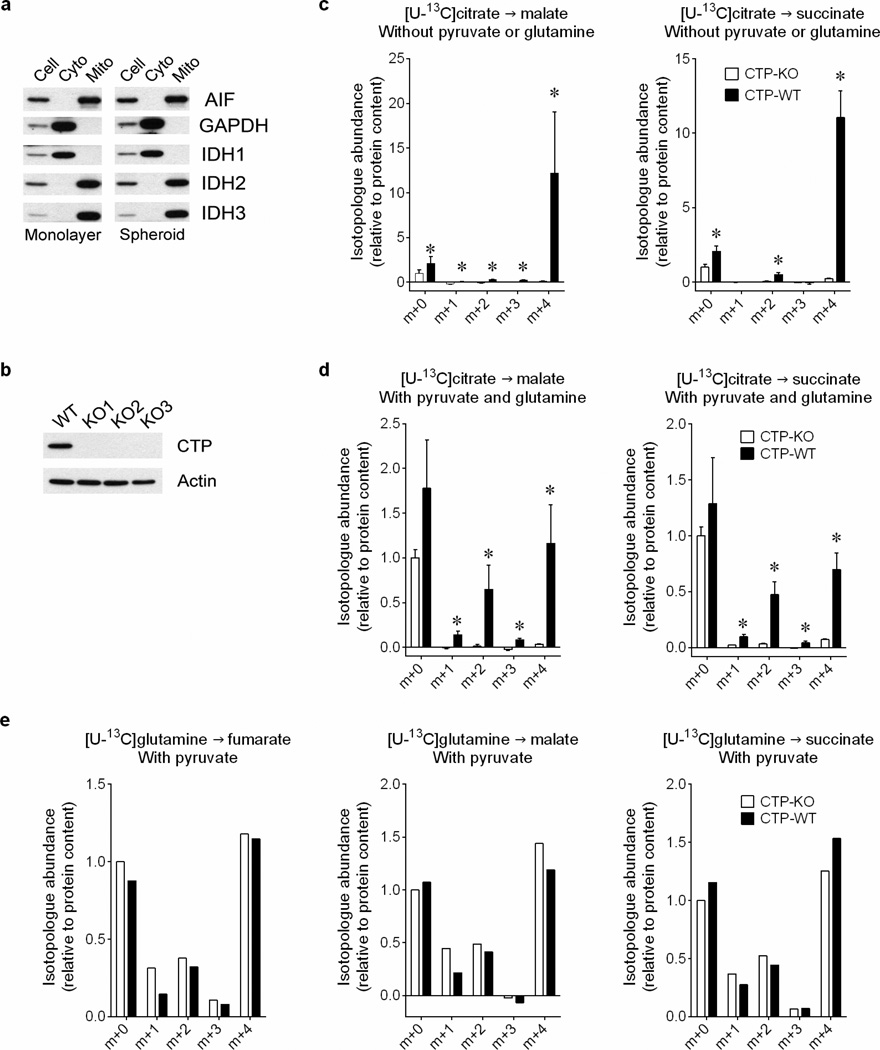
Extended Data Figure 8. Mitochondria take up and metabolize citrate.
a, Protein expression of mitochondrial and cytosolic markers in subcellular fractions of monolayer and spheroid culture. b, Protein expression of CTP in control and CTP-deficient H460 cells. c, Mass isotopologues of malate and succinate in isolated mitochondria cultured with [U-13C]citrate (n=4 cultures from two experiments). d, Mass isotopologues of malate and succinate in isolated mitochondria cultured with [U-13C]citrate, unlabeled pyruvate and glutamine (n=4 cultures from two experiments). e, Mass isotopologues of fumarate, malate and succinate in isolated mitochondria cultured with [U-13C]glutamine and unlabeled pyruvate (n=2 cultures from a representative experiment). *p<0.05, Welch's unequal variances t-test. Experiments in e were repeated twice, and all other experiments were repeated 3 times or more.

