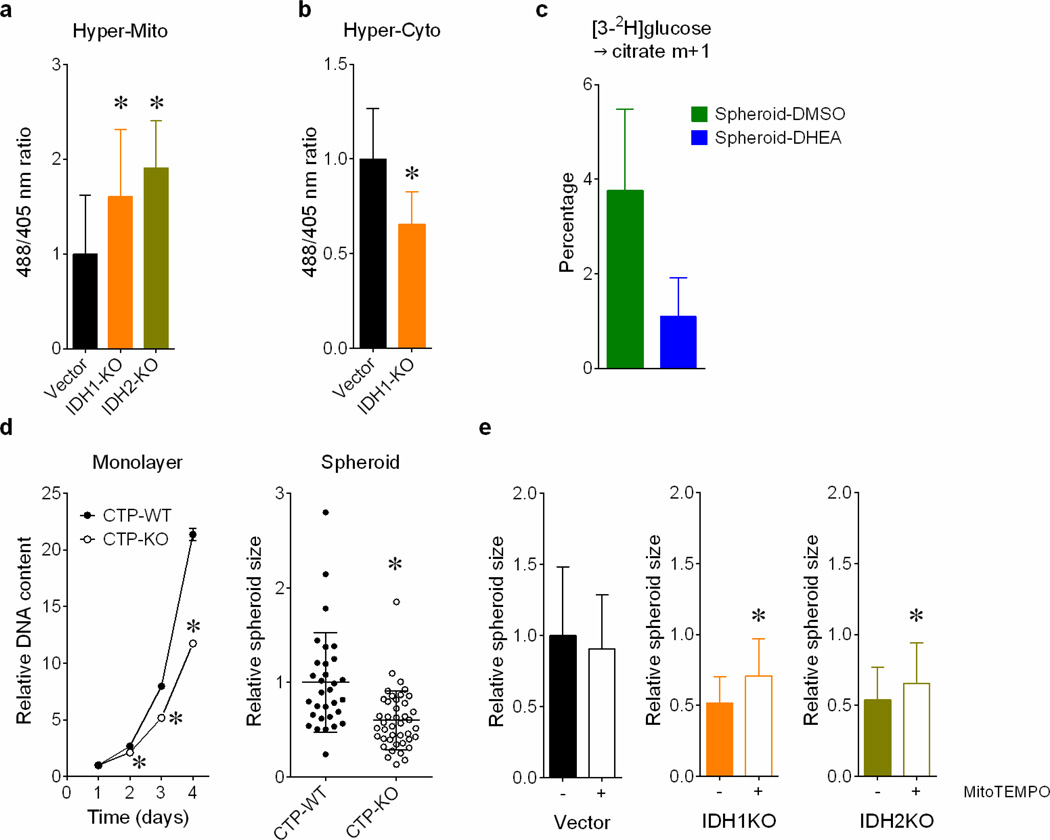
Extended Data Figure 9. Reductive glutamine metabolism mitigates mitochondrial ROS and promotes spheroid growth.
Mitochondrial (a) and cytosolic (b) ROS detected by a genetic hydrogen peroxide sensor in H460 spheroids containing or lacking IDH1 or IDH2. (n=29 Vector spheroids; n=26 IDH1-KO and IDH2-KO spheroids in panel a; n=23 Vector spheroids; n=22 IDH1-KO spheroids in panel b). c, Deuterium labeling of citrate in H460 spheroids without and with the pentose phosphate pathway inhibitor DHEA (n=3 cultures from a representative experiment). d, Growth of H460 cells containing or lacking CTP in monolayer conditions (left) and as spheroids (right) (n=6 monolayer cultures; n=31 CTP-WT spheroids; n=42 CTP-KO spheroids). e, Size of H460 spheroids containing or lacking IDH1 or IDH2, and treated with or without the mitochondrial ROS scavenger MitoTEMPO. (n=40 Vector “−” spheroids; n=52 Vector “+” spheroids; n=46 IDH1KO “−“ and “+” spheroids; n=48 IDH2KO “−” spheroids; n=52 IDH2KO “+” spheroids). *p<0.05, ANOVA (a), or Welch's unequal variances t-test (b–e). All experiments were repeated 3 times or more.

