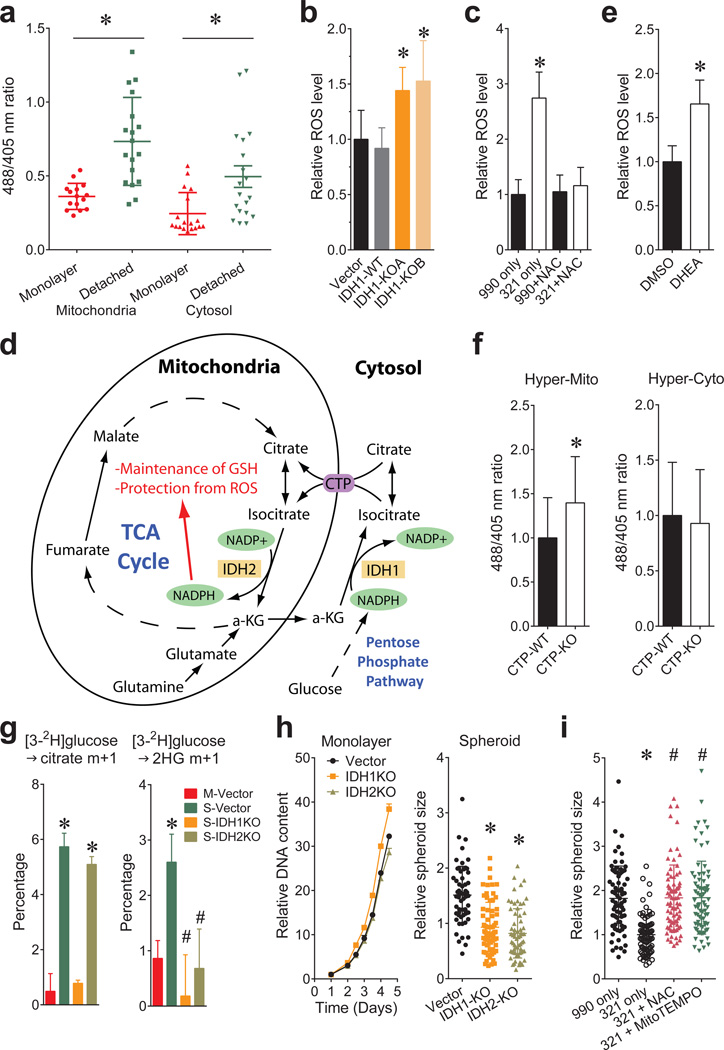
Figure 4. Reductive glutamine metabolism mitigates mitochondrial ROS and promotes spheroid growth.
a, Transient expression of mitochondrial and cytosolic hydrogen peroxide reporter (HyPer) vectors in H460 cells. Cells were cultured under monolayer or detached conditions for 48 hours before imaging to assess ROS levels. (n=15 HyperMito monolayer cells; n=18 HyperMito detached cells; n=18 HyperCyto monolayer cells; n=19 HyperCyto detached cells). b, Staining of parental or IDH1-deficient H460 spheroids with the mitochondrial ROS sensor MitoSOX. (n=16 Vector spheroids; n=18 IDH1-WT spheroids; n=17 IDH1-KOA spheroids; n=15 IDH1-KOB spheroids). c, Effect of IDH1 inhibition by compound 321 and the ROS scavenger N-acetylcysteine (NAC) on MitoSOX signal in H460 spheroids. (n=31 990 only spheroids; n=25 321 only spheroids; n=33 990+NAC spheroids; n=30 321+NAC spheroids). d, Pathway through which cytosolic reductive carboxylation, followed by isocitrate/citrate import into the mitochondria, can contribute to the mitochondrial NADPH pool and suppress mitochondrial ROS. e, MitoSOX staining of DHEA-treated H460 spheroids (n=53 spheroids for each condition). f, HyPer signal for mitochondrial (left) and cytosolic (right) ROS in H460 cells containing or lacking CTP. (n=28 HyperCyto CTP-KO cells; n=35 cells for all other conditions). g, Labeling from [3-2H]glucose in citrate (left) or 2-HG (right) in H460-derived cells expressing mutant IDH2 and containing or lacking wild type IDH1 and IDH2 (n=3 cultures, *p<0.05, comparing to M-Vector, #p<0.05, comparing to S-Vector). M, monolayer; S, spheroid. h, Monolayer and spheroid growth of H460 cells containing or lacking IDH1 or IDH2. (n=6 monolayer cultures for each cell line; n=59 Vector spheroids; n=70 IDH1-KO spheroids; n=65 IDH2-KO spheroids). i, Spheroid size after 8 days of 321 treatment, with or without NAC or the mitochondrial ROS scavenger MitoTEMPO. (n=75 990 only spheroids; n=77 321 only spheroids; n=81 321+NAC spheroids; n=77 321+MitoTEMPO spheroids, #p<0.05 comparing to treatment with 321 only). *,#p<0.05, ANOVA (b, c, g, h and i), or Welch's unequal variances t-test (a, e and f). Experiment in f were repeated twice, and all other experiments were repeated 3 times or more.

