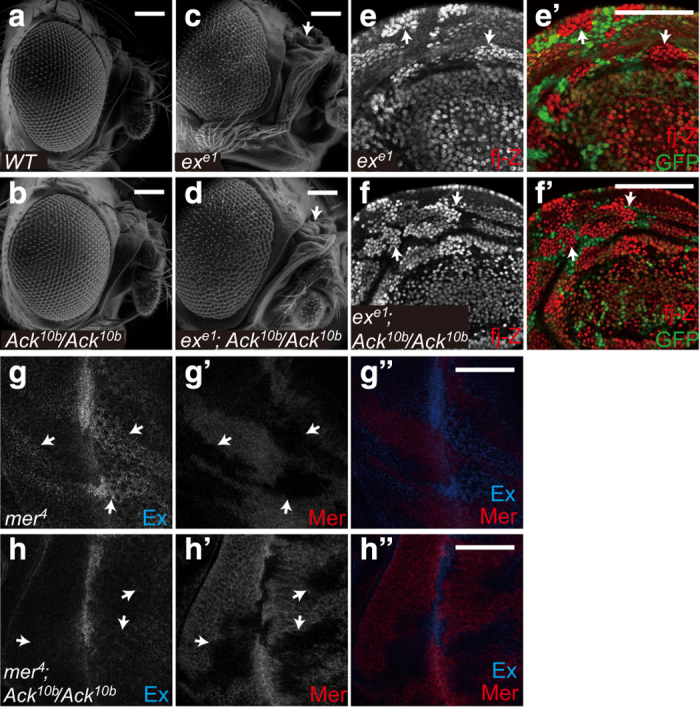
Figure 6.

Genetic interaction between Ack and Ex/Mer. (a–d) Homozygous loss of ack cannot suppress ex mutant-induced tissue overgrowth. Scan electronic micrographs of adult fly head of the indicated genotype. Arrows indicated overgrowth in ex mutant. The genotypes were the following: eyflp; exe1 FRT40A/ubi-GFP FRT40A (c), eyflp; exe1 FRT40A/ubi-GFP FRT40A; Ack10b/Ack10b (d). Scale bar is 100 μm. (e–f′) Wing discs containing exe1 clones or exe1;Ack10b/10b clones were immunostained to show fj-lacZ (fj-Z) and GFP expression. exe1 clones were marked by the loss of GFP signal. Arrows indicated upregulation of fj-Z expression in exe1 clones. Note that homozygous loss of ack cannot suppress ex mutant-induced upregulation of fj-Z. The genotypes were the following: hsflp; exe1 fj-Z FRT40A/ubi-GFP FRT40A (e–e′), hsflp; exe1 fj-Z FRT40A/ubi-GFP FRT40A; Ack10b/Ack10b (f–f’). Scale bar is 50 μm. (g–h′′) Eye discs containing mer4 clones or mer4; Ack10b/10b clones were immunostained to show Ex and Mer expression. Note that homozygous loss of ack suppresses mer mutant-induced upregulation of Ex. Arrows indicated the clone boundary. The genotypes were the following: eyflp, mer4 FRT19A/FRT19A (g–g′′), eyflp, mer4 FRT19A/FRT19A;;Ack10b/Ack10b (h–h′′). Scale bar is 50 μm.
