Figure 2.
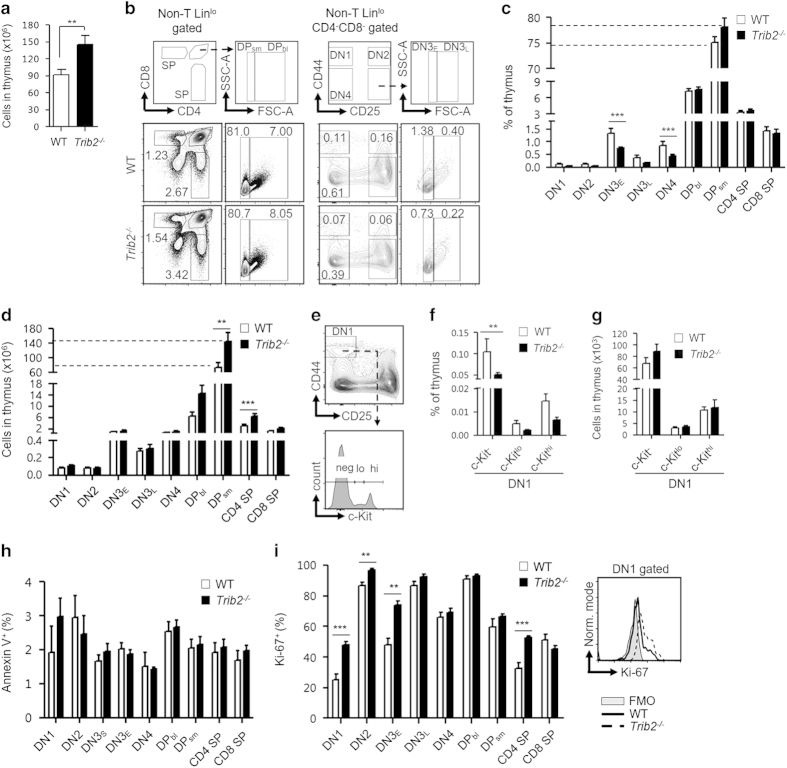
TRIB2 regulates the homeostasis of intrathymic T-cell development. (a) Thymic cellularity of WT (n=31) and Trib2−/− (n=21) mice was counted by trypan blue exclusion after RBC lysis. (b) Flow cytometry of thymic subsets. The complete gating strategy is provided in Supplementary Figure S3. Each subset is indicated in the outlined areas (top row). The corresponded values in the representative staining profile of WT (middle row) and Trib2−/− (bottom row) mice are frequency of thymus and graphed in c. CD4 SP, CD4+CD8−; CD8 SP, CD4−CD8+; DN1, LinloCD44+CD25−; DN2, LinloCD44+CD25+; DN3E, LinloCD44−CD25+FSClo; DN3L, LinloCD44−CD25+FSChi; DN4, LinloCD44−CD25−; DPbl, CD4+CD8+FSChi; DPsm, CD4+CD8+FSClo; FSC-A, forward scatter-area; SSC-A, side scatter-area. (d) Number of cells for each subset. (e) Further characterization of DN1 cells based on c-Kit surface expression. hi, high; lo, low; Neg, negative. DN1 subsets were graphed in frequency of thymus (f) and cell number (g). For c, d, f and g, n=7–8 per genotype. (h) Basal level of apoptosis of each thymic subset (n=3 per genotype) was determined by the surface expression of Annexin V after exclusion of DAPI-stained dead cells. (i) Intracellular level of Ki-67 across thymic subsets (n=4–5 per genotype) was measured by flow cytometry (left). An overlap of histogram (right) showed Trib2−/− DN1 cells had higher level of Ki-67 compared with that of WT. FMO, Fluorescence Minus One; Norm, normalized. For statistical analyses, unpaired Student’s t-test was used for a, i, and two-way ANOVA was used for c, d and f. **P<0.01; ***P<0.001, all quantified data are presented as mean and s.e.m. ANOVA, analysis of variance; DAPI, 4′, 6-diamidino-2-phenylindole; RBC, red blood cell; SP, single positive.

