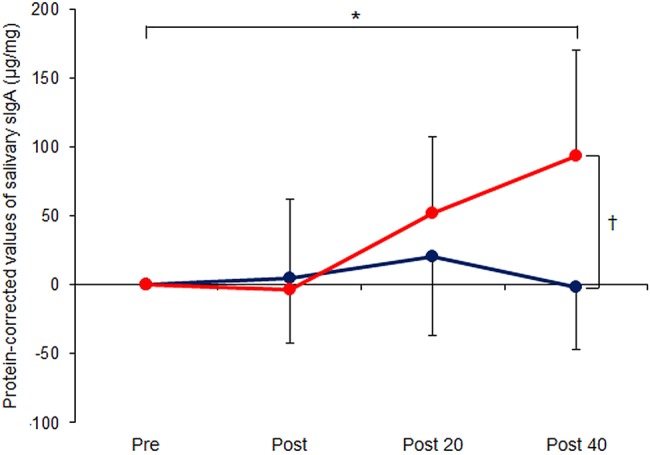
Figure 4.

Serial measurements of salivary immunoglobulin A (sIgA), determined by ELISA and corrected for salivary protein levels, in 16 healthy volunteers immediately before/after and 20/40 min following 15 min electroacupuncture (EA) at LI4+LI11 (EA group, red circles, n=8) or 15 min rest (control group, blue circles, n=8). Data are mean±SD. *p<0.05 comparing across time points (using repeated measures analysis of variance); †p<0.05 comparing across groups (using Student's t test).
