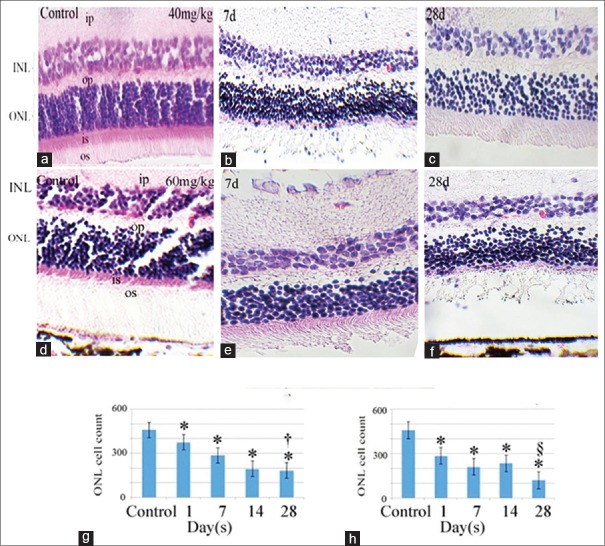
Figure 2.
Histological cross section of the retina stained with hematoxylin and eosin. The upper panels (b and c) show specimens prepared 7 and 28 days after 40 mg/kg injection of retrobulbar sodium iodate. Lower panels (e and f) show specimens 7 and 28 days after 60 mg/kg of sodium iodate injection, respectively. a and d represent sections from normal retinas before any injection. Histograms (g and h, 40 and 60 mg/kg of sodium iodate, respectively) represent the morphometric evaluation of the outer nuclear layer (ONL cell count: Image J) in the control group and 1, 7, 14 and 28 days after injection. *This sign indicates a significant difference in ONL cell count between the control sections and sections of treated eyes from other time points. Indicates significantly lower ONL cell count in 28 days than the other time points except that of 14 days in 40 mg/kg group. § Indicates significantly lower ONL cell count than the other time points in 60 mg/kg group. OS, outer segment of photoreceptors; ONL, outer nuclear layer; OP, outer plexiform layer; INL, inner nuclear layer; IP, inner plexiform layer; Scale bar, A, B and D = 120 µm; C, E andF= 60 µm.

