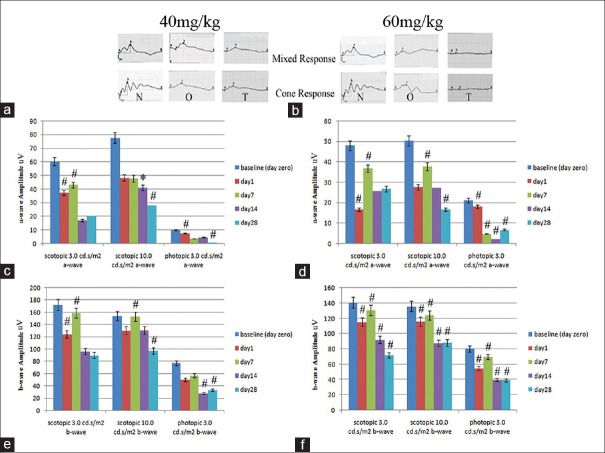
Figure 3.
a and b show representative electroretinogram waveforms of the scotopic maximum combined and photopic responses, respectively. N: Before NaIO3 injection, O: One day and T: 28 days after sodium iodate administration at doses of 40 and 60 mg/kg, respectively. c and d represent the histograms of mean amplitudes of the a-wave with 40 and 60 mg/kg sodium iodate, from day 0 (before injection) to 1, 7, 14 and 28 days after injection, repectively. e andfrepresent mean amplitudes of the b-wave with 40 and 60 mg/kg sodium iodate, from day 0 (before injection) to 1, 7, 14 and 28 days after injection, respectively. (*Indicates a significant reduction in mean amplitudes compared to mean amplitudes recorded before Sodium iodate injection).

