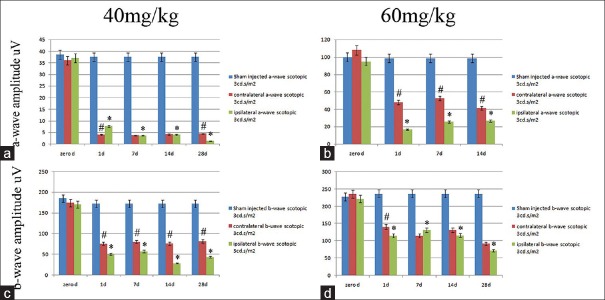
Figure 4.
Comparison of mean a-wave amplitudes (a and b) and b-wave amplitudes (c and d) of the scotopic maximal combined electroretinograms (3 cd.s/m2 intensity), for eyes from the sham group (blue columns), sodium iodate injection of the left or ipsilateral eyes (green columns) and the right or contralateral eyes (red columns), of the 40 mg/kg (a and c) and 60 mg/kg (b and d) dose groups, in consecutive time points from before injection to 1, 7, 14 and 28 days after injection, respectively. (*Asterisk indicates a significant difference between the sham treated and other time point values in treated animals (P< 0.05). (#Indicates a significant difference between the contralateral eyes or red columns and ipsilateral eyes or green columns,P< 0.05).

