
Figure 5.
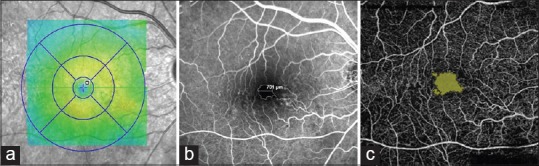
Images of a patient with non-proliferative diabetic retinopathy but no macular edema. (a) Macular thickness map using spectral domain optical coherence tomography (SD-OCT). (b) Conventional fluorescein angiography (FA) with leaking micro aneurysm and ischemia temporal to the fovea. (c) optical coherence tomography angiography (OCTA) image of the superficial plexus of the same patient shows better delineation of the ischemic area as compared to FA.