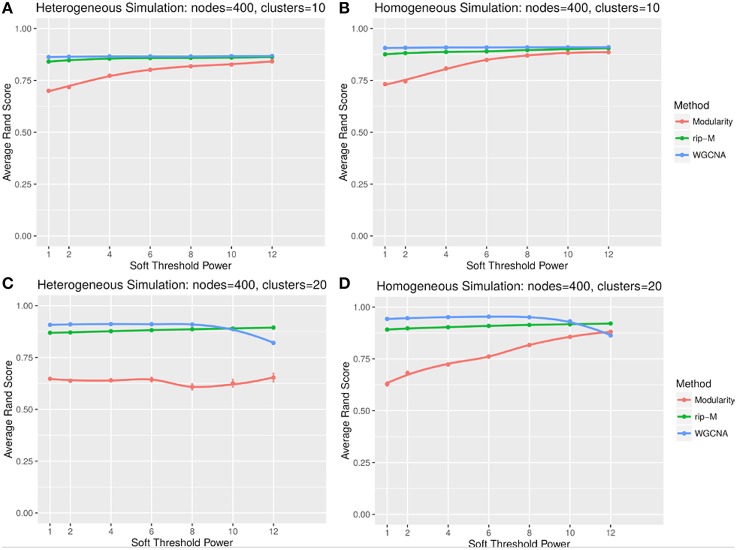
Figure 6.
Comparison of clustering accuracy using soft thresholds for random uniform simulated heterogeneous (A,C) and homogeneous (B,D) cluster sizes with 10 clusters (A,B) and 20 clusters (C,D). The signal and noise parameters are rsignal, min = 0.2 and rnoise, max = 0.8, respectively. One hundred replicate simulations are created and clustering is carried for varying soft threshold powers, which involves taking the element-wise powers of the correlation matrix. The accuracy of the clustering methods (on the vertical axis) is based on the Rand index of the cluster identities compared with the true simulated cluster identities.

