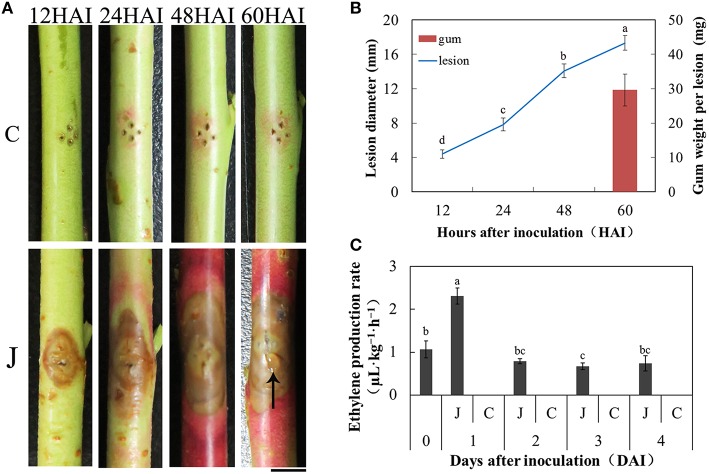
Figure 1.
Peach gummosis development and ethylene production rate. (A) Development of symptoms of peach current-year detached shoots inoculated with L. theobromae. C, mock-inoculated peach shoots; J, inoculated peach shoots; HAI, hours after inoculation; The black arrow indicates gum exudation; Bar is 5 mm. (B) Dynamic changes in lesion diameter at different hours and gum weight per lesion at 60 HAI. The values presented are the means ± SD of six independent determinations. (C) ET production rate of the inoculated and mock-inoculated current-year peach shoots. At 0 days, the shoots were only wounded. In the days following, no ET was detectable in control shoots. Data were analyzed by ANOVA using SAS program package (version 8.1; SAS Institute, Cary, NC) to determine differences in lesion diameter (B) and ET production rate (C). Means with the same letters are not significantly different at the 5% level by Duncan's multiple range test.

