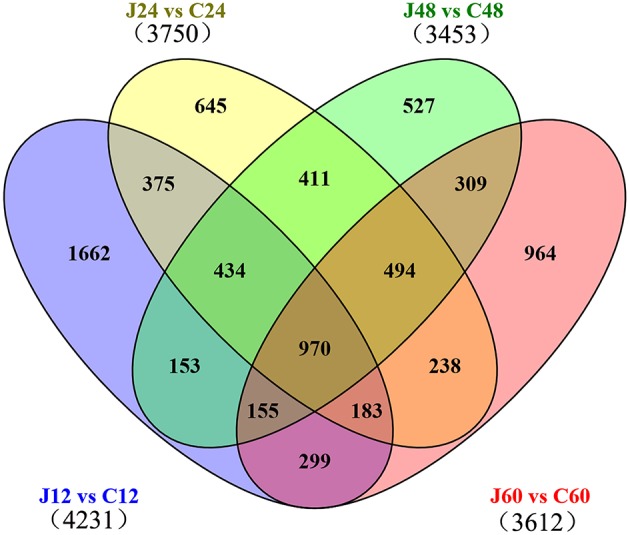
Figure 2.

Venn diagram of differentially expressed genes among the four comparisons performed (J12 vs. C12, J24 vs. C24, J48 vs. C48, and J60 vs. C60). “J12 vs. C12” means a comparison between the inoculated (J) and mock-inoculated (C) peach shoots at 12 h after inoculation.
