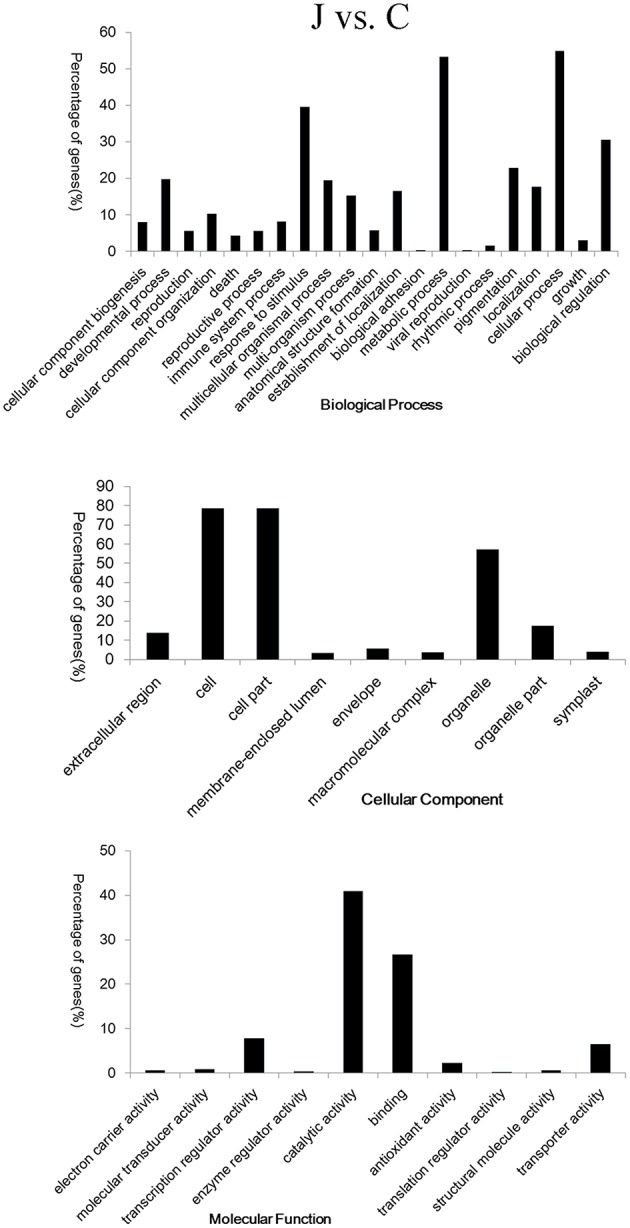
Figure 3.

Gene ontology (GO) classification of the 920 co-differentially expressed genes in the inoculated (J) and mock-inoculated (C) peach shoots. Annotations are grouped by biological process, cellular component, and molecular function. The percentage of genes (%) is listed for each category.
