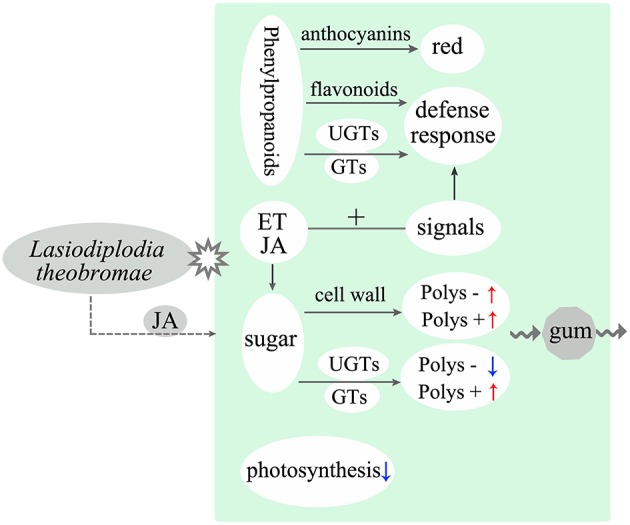
Figure 5.

Model illustrating the main molecular response and gum polysaccharide formation of peach shoots infected with L. theobromae. “Polys –” means polysaccharide degradation. “Polys +” indicates polysaccharide biosynthesis. Red and blue arrows represent upregulation and downregulation, respectively. Dotted arrow shows a supposed interaction.
