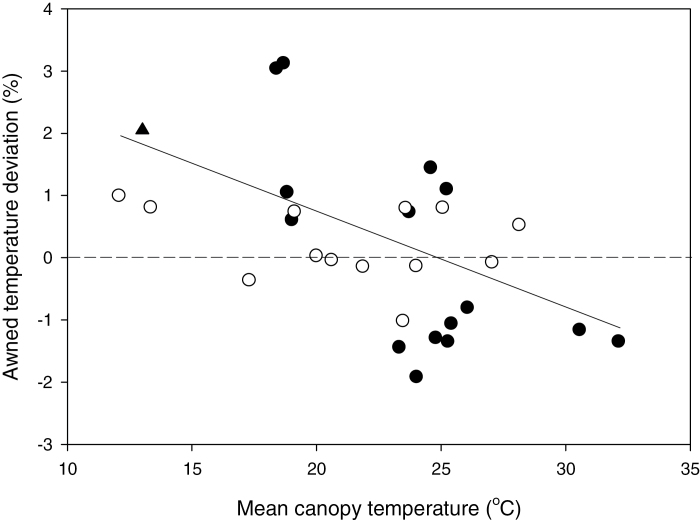
Fig. 3.
Awned–awnletted NIL canopy temperature (CT) deviation (expressed as a percentage of awned NIL CT) for day (open circles) and night (open triangles) sampling measured across the different experiments. Statistically different CT between awned and awnletted NILs (P <0.05) are denoted as filled symbols. The relationship for percentage temperature deviation and mean CT is: y=3.49–0.149x (r 2=0.33, P <0.01).

