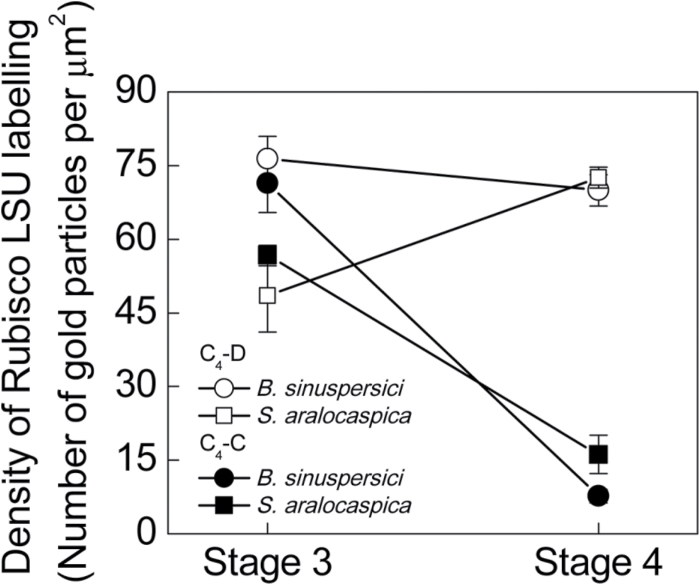
Fig. 5.
Quantitative graphical representation showing the density of immunolabeling for Rubisco rbcL in peripheral (●) versus CCC chloroplasts (○) in Bienertia sinuspersici, and in distal (■) versus proximal (□) chloroplasts of Suaeda aralocaspica at Stages 3 and 4 of development in young leaves. The y axis represents the number of gold particles per μm2 of chloroplast, and the x axis represents the developmental stages. 10–15 cell areas were used for counting in each cell type and for each stage of development.

