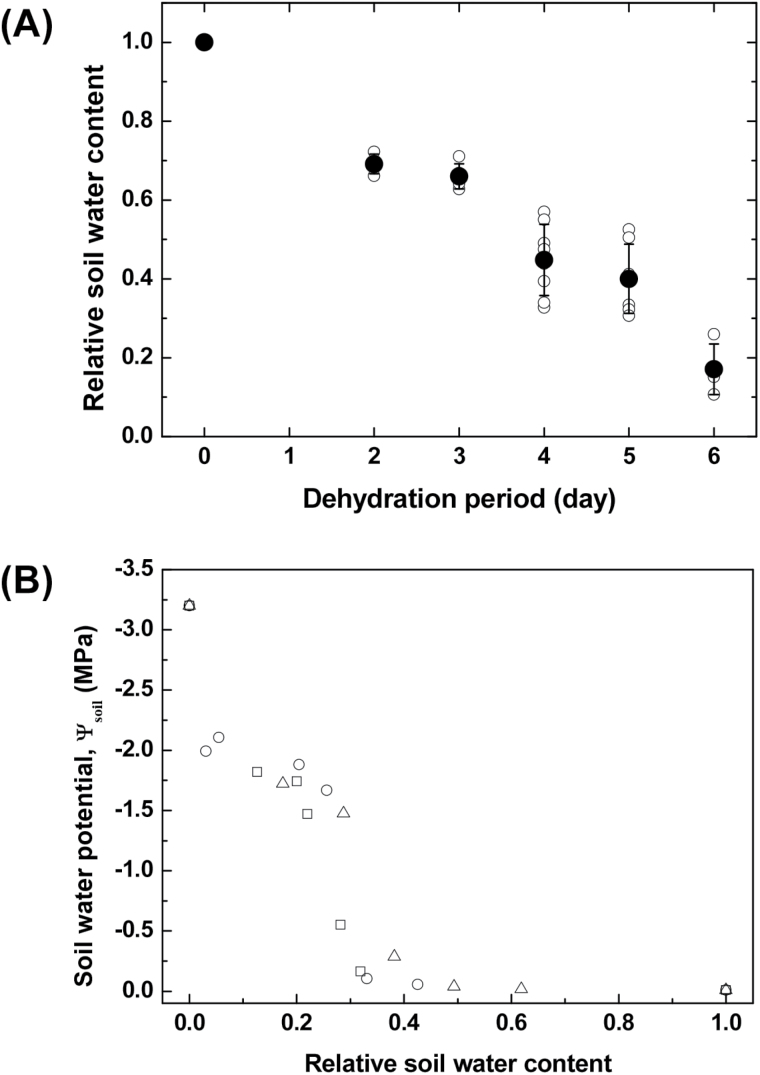
Fig. 1.
(A) RSWC of six different irrigation regimes for different soil-drying periods. Open symbols indicate experimental data of test samples (n=3, 4, 5, 6, 7, and 4 sample plants for 0, 2, 3, 4, 5, and 6 d of dehydration). Closed symbols represent statistically averaged RSWCs. Error bars indicate SD. (B) Variation of soil water potential (Ψsoil) according to RSWC. Open circle, square, and triangle symbols denote soil water potentials measured with changing RSWC in three repeated experiments (n=3).

