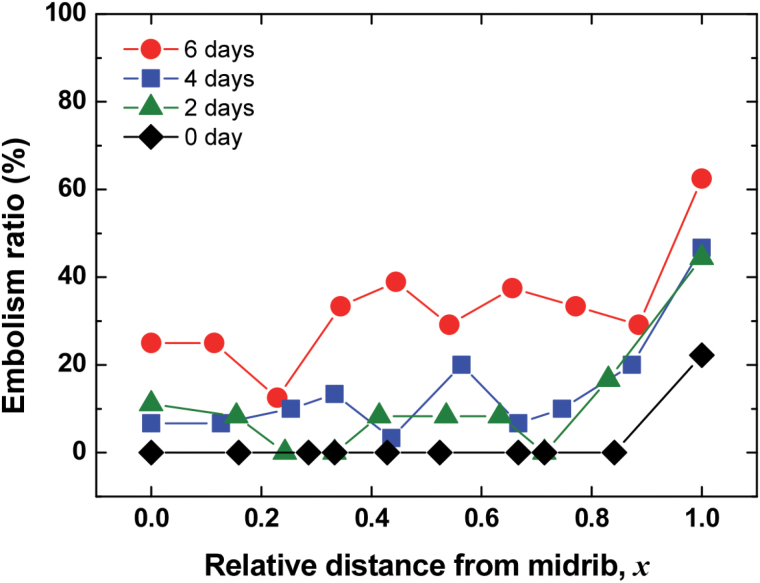
Fig. 5.
Spatial variations in embolism ratios with respect to relative distance from the midrib. Red circles denote embolism ratios of plant samples dehydrated for 6 d (n=4); blue rectangles, green triangles, and black diamonds denote embolism ratios of samples dehydrated for 4 d (n=5), 2 d (n=3), and 0 d (n=3), respectively. Each symbol represents statistically averaged embolism ratio in xylem vessels. This figure is available in colour at JXB online.

