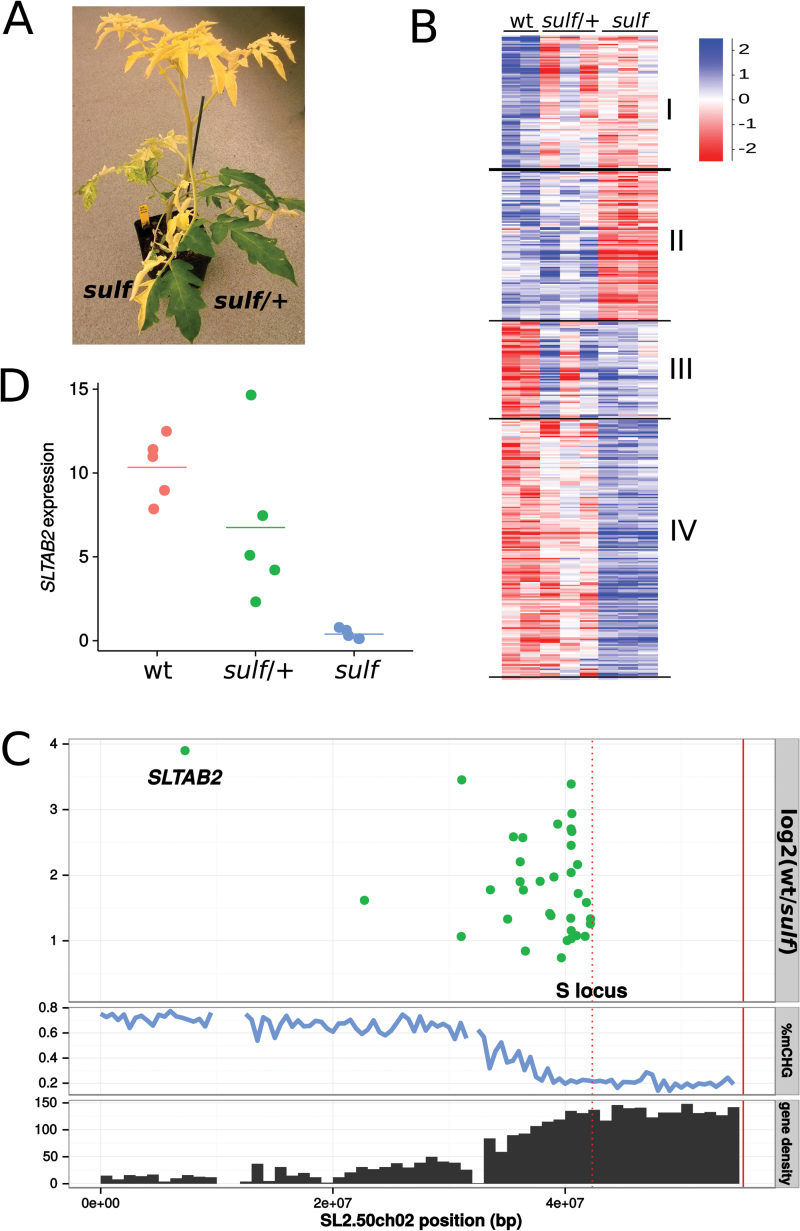
Fig. 1.
(A) Fully paramutated yellow sulf tissue and non-paramutated green sulf/+ tissue on a plant grown from a heterozygous seed. (B) Hierarchical clustering of 2 237 differentially expressed genes between wt and sulf. With a correlation coefficient of 0.7, 2 223 genes fall into four broad categories: down-regulated in sulf and sulf/+ (I), down-regulated in sulf only (II), up-regulated in sulf and sulf/+ (III), and up-regulated in sulf only (IV). Values are log2-transformed library-normalized/median-normalized counts. (C) Down-regulated genes in sulf on chromosome 2. Log2 fold-change wt/sulf of significantly down-regulated genes (adjusted P <0.05). Percentage CHG methylation and gene density (genes/Mb) are plotted along chromosome 2 to show the distribution of heterochromatin. The S locus (red dotted line) marks the right-most border for the possible location of SULFUREA (Hagemann and Snoad, 1971). The end of the chromosome is marked by a solid red line. (D) SLTAB2 expression in wt, sulf/+ (green) and sulf (yellow) leaves. Horizontal bar shows the mean of five biological replicates. 26-fold reduction in sulf compared with wt (P-value=0.0002324, two–tailed t test), while the difference between wt and sulf/+ is not significant (P-value=0.1771).

