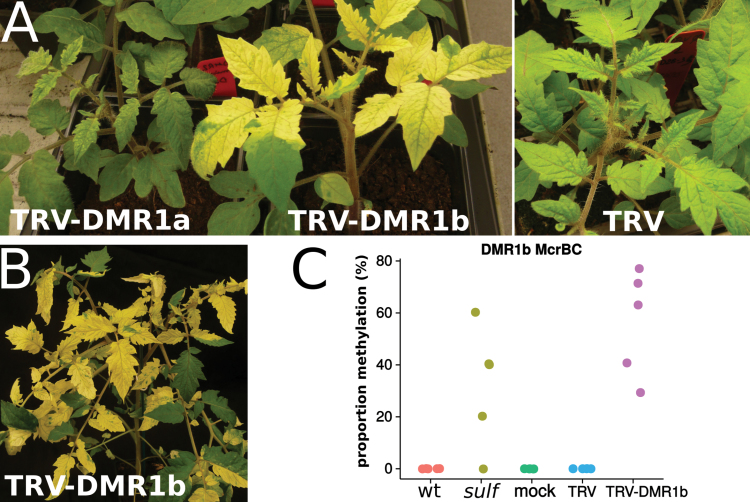
Fig. 6.
VIGS of SLTAB2 DMR1. (A) At 3 weeks post-infection, plants infected with TRV-DMR1b displayed large chlorotic sectors. Between 13 and 16 plants were infected for each condition. (B) These sulfurea-like sectors remained in later leaves at 2 months after infection. (C) Methylation of DMR1 is detectable in chlorotic sectors. The proportion of methylation is calculated from the ratio of amplicons in the McrBC-digested versus undigested samples (as determined by qPCR). If all alleles are highly methylated (100% methylation), they will be digested by McrBC and no amplification will occur during qPCR.

