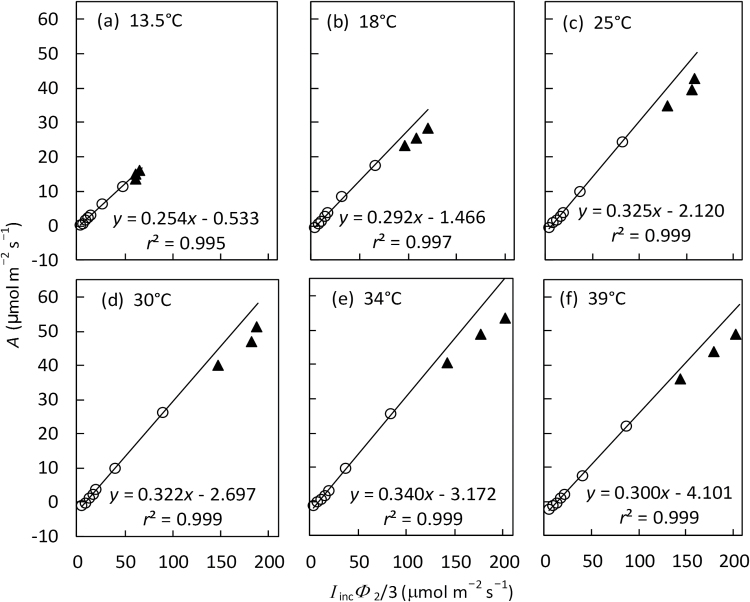
Fig. 3.
The relationship between net CO2 assimilation rate A and the lumped variable I incΦ2/3 (mean of four replicates) from irradiance response curves under non-photorespiratory conditions (i.e. at 2% O2 combined with high CO2) at six leaf temperatures. Open circles are for I inc ≤500 μmol m−2 s−1 and filled triangles come from the three levels of I inc >500 μmol m−2 s−1. The lines represent linear regression based on data with I inc ≤500 μmol m−2 s−1, in which the slope gives the estimate of calibration factor s′ and the intercept gives the estimate of day respiration R d (see the text).

