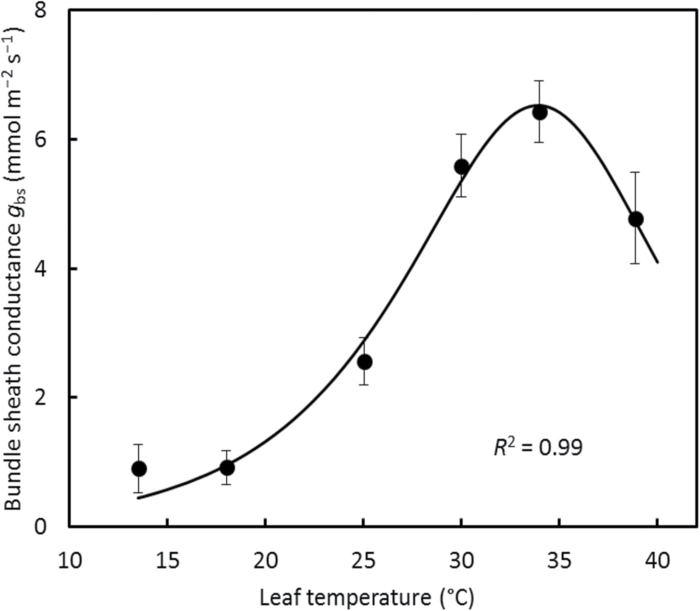
Fig. 6.
Temperature response of estimated bundle-sheath conductance g bs in maize leaves. The error bar at each point represents ±SE of the estimate. The curve represents the peaked Arrhenius fit of Equation 4 with estimated values of the parameters in Table 2.

