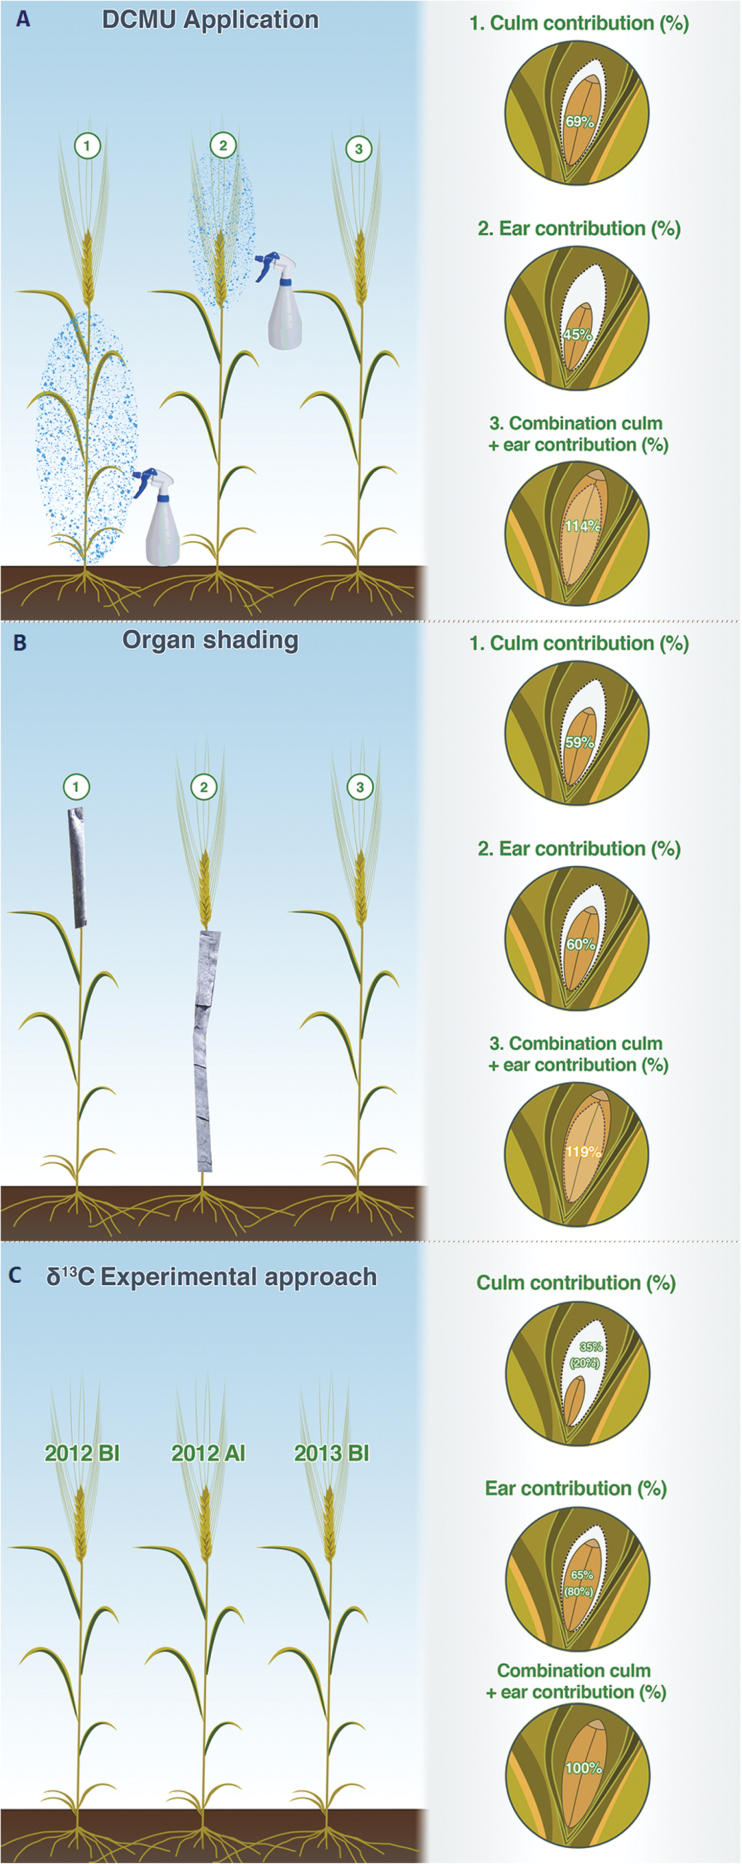
Fig. 1.
Illustration of a wheat plant showing the relative photosynthetic contributions of the ear and culm to grain filling as estimated with three methodologies: (A) DCMU treatment (2012 growing cycle) with DCMU application to the culm (1) and the ear (2) and a combination of culm plus ear contribution to grain filling (3); (B) shading treatment (2013 growing cycle) with shaded ear (1) and shaded culm (2) and a combination of culm plus ear contribution to grain filling (3); and (C) the δ13C approach of the six genotypes of bread wheat. The percentage contribution (%) of the culm and ear were calculated relative to control (see ‘Materials and methods’ equation 1 and Supplementary Table S3). The relative (%) culm and ear contribution to grain filling in the δ13C approach was calculated as the proportion of the δ13Cpeduncle and δ13Cawns contributing to the δ13C of mature kernels. Values presented are the averages of values calculated using δ13Cpeduncle and δ13Cawns values of the WSF from samples taken in the 2012 crop cycle (BI and AI) and for the 2013 crop cycle. The contribution of the ear considering the glumes (in addition of the awns) was also calculated using δ13Cpeduncle and δ13Cawns+glumes values of the WSF from samples taken in the 2012 BI crop cycle (and for the 2013 crop cycle (value expressed between brackets). For all three approaches values presented are the averaged values ±SD of the six bread wheat genotypes and three replications per genotype. The experiment was performed under field conditions at the CIMMYT’s Experimental Station, Norman E. Borlaug (CENEB), under fully irrigated conditions (This figure is available in colour at JXB online.).

