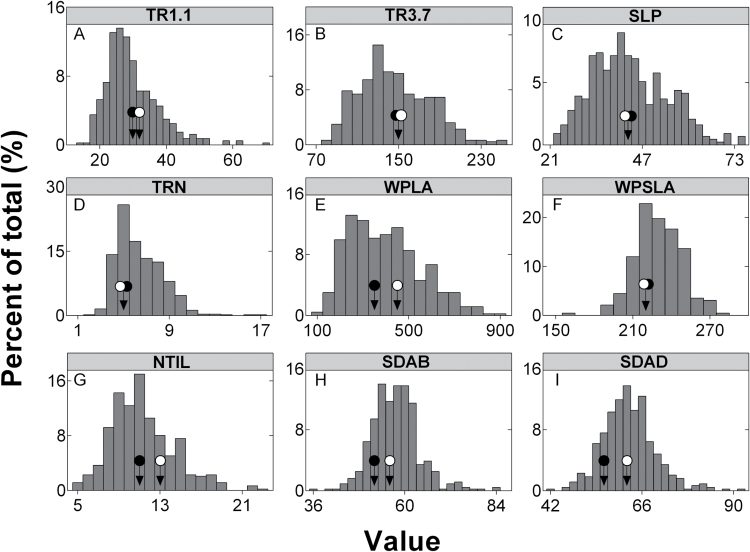
Fig. 2.
Frequency distributions of the traits measured for the RAC875×Kukri DH population of 143 lines. Black and white circles indicate the positions of the parents RAC875 and Kukri, respectively. The units for the traits are: mg H2O m−2 s−1 (TR1.1, TR3.7, TRN); mg H2O m−2 s−1 kPa−1 (SLP); cm2 (WPLA); cm2 g−1 (SLA); mm−2 (SDAB, SDAD).

