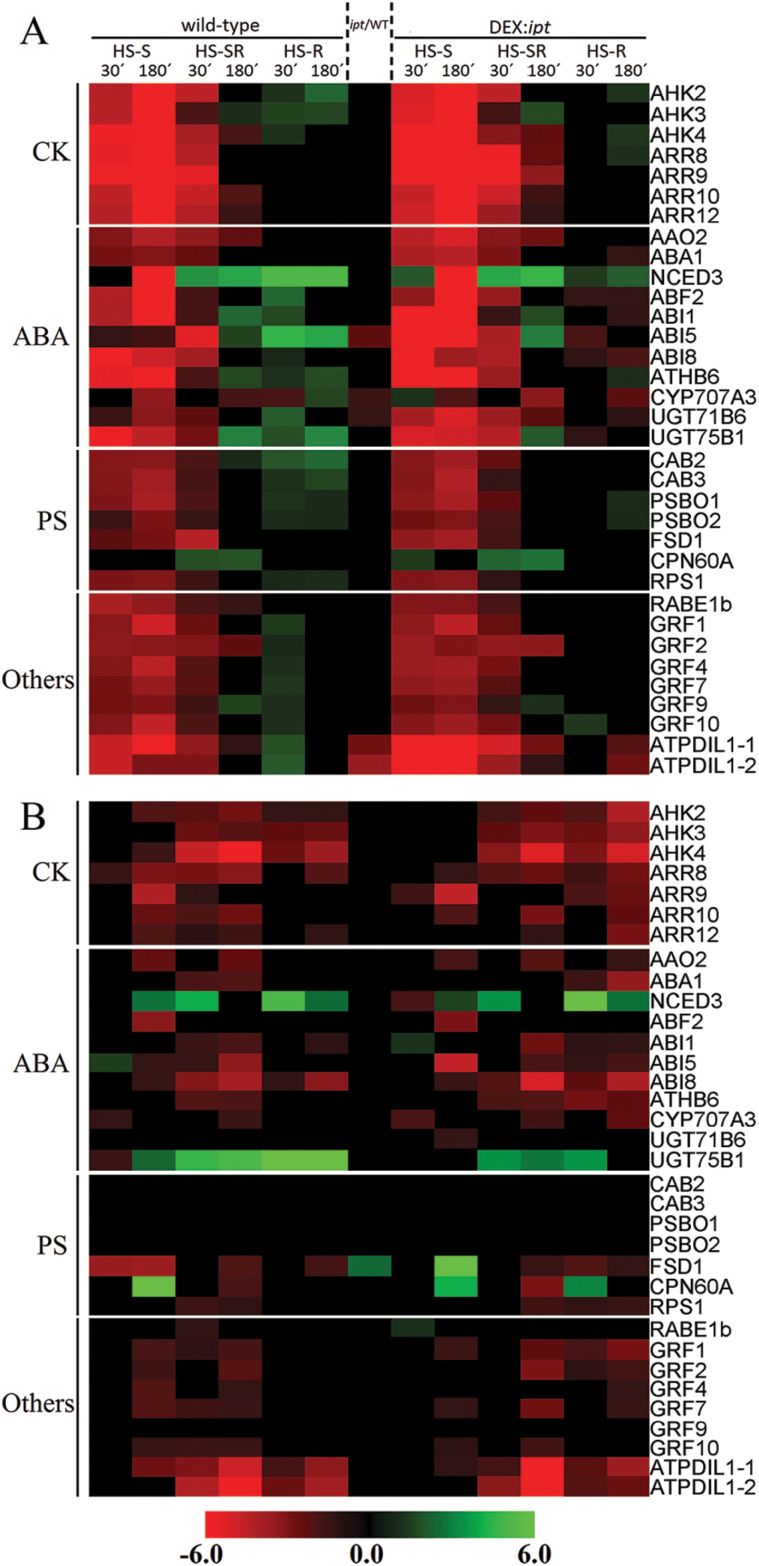
Fig. 4.
Effect of heat stress targeting on expression profiles of 46 selected hormone- or stress-related genes. The heat map represents fold changes in the abundance of gene transcripts in leaves (A) and roots (B) after heat stress (40 °C) targeted to shoots (S), roots (R) and whole plant (SR) compared with the control. HS duration was 30 or 180min (as indicated). The genes are grouped according to their function (cytokinin, abscisic acid, photosynthesis and stress related).

