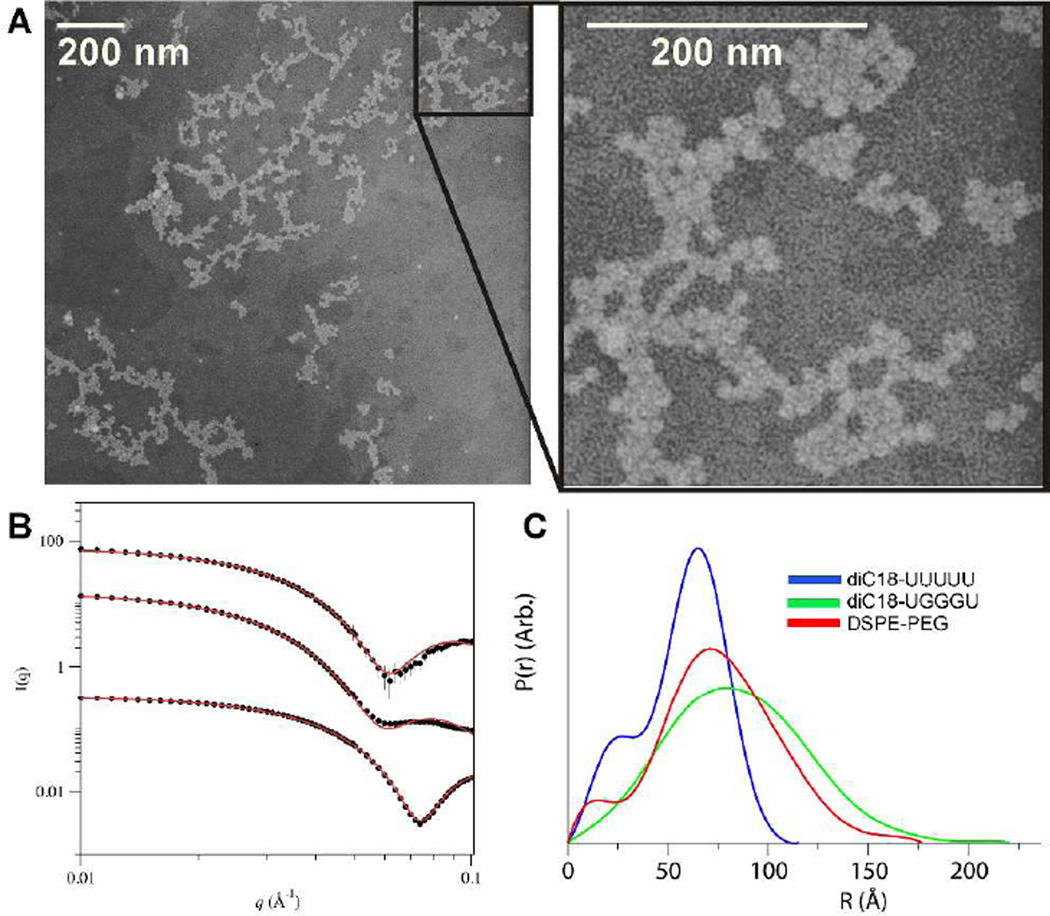
Figure 2.
Micelle characterization. (A) TEM image of diC18-UGGGU micelles. (B) Experimental SAXS profiles of DSPE-PEG, diC18-UGGGU, and diC18-UUUUU micelles each at 2 mg/mL, from top to bottom, and fitted profiles from ellipsoid model fits (red lines). diC18-UGGGU and diC18-UUUUU data sets were vertically offset by scaling intensity values of 10−2 and 10−3, respectively. (C) Intraparticle distance distribution p(r) for diC18-UUUUU micelles (blue), diC18-UGGGU micelles (green), and DSPE-PEG micelles (red).

