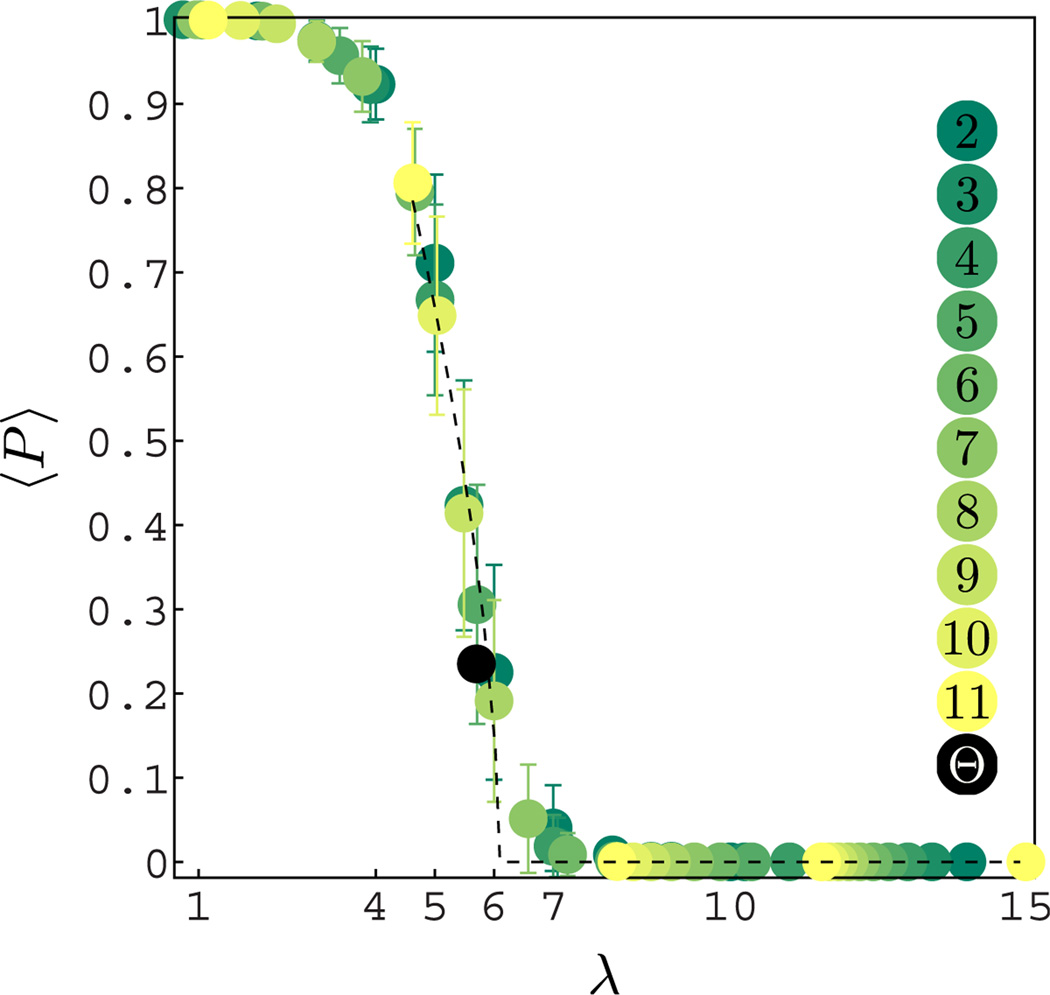
Fig. 6.
Plot of the average percolation order parameter < P > for natural images for binary and general base decomposition b = {2, 3, …, 11} (color-coded in the figure) as a function of λ. The λ in base b is transformed to base 2 by the relation ⌊log2(Imax) + 1⌋− log2(b⌊logb(Imax)+1⌋−λ). The standard deviation is indicated by the error bars. The black curve is the best fit near the phase transition P = θ(λc − λ) (λc− λ)β/C (where θ is the step function) was obtained for λc = 6.1; β = 0.6, C = 1.6. Percolation order parameter was also calculated for the ensemble Θ and is given in black at the position λ = 5.7 obtained from the average median values in the van Hateren database.

