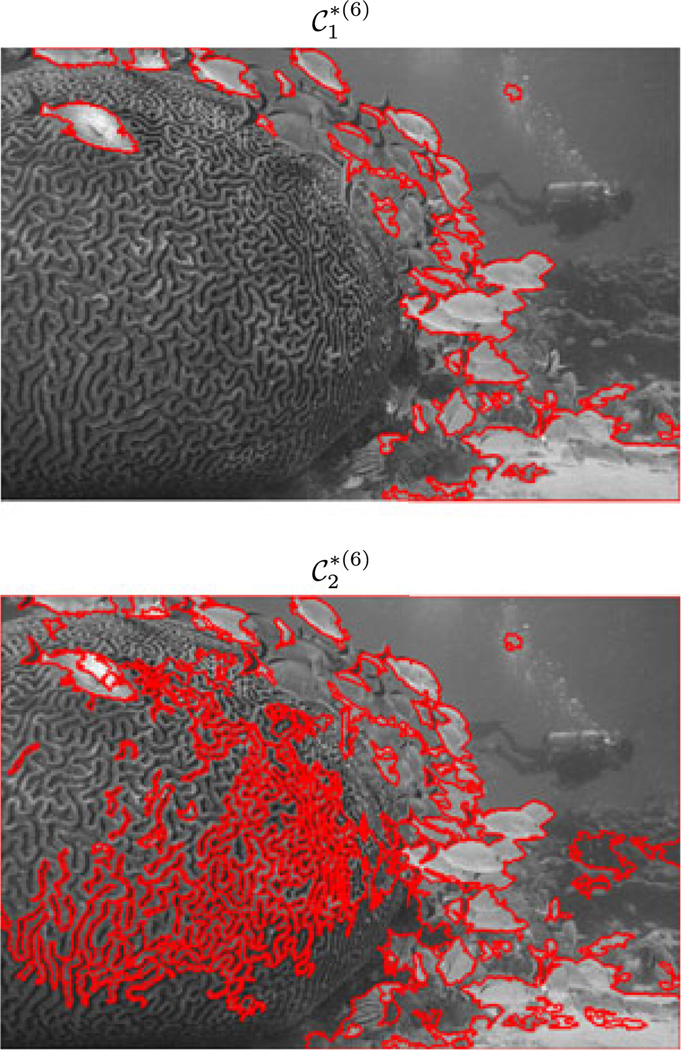
Fig. 9.
Example of an image in the Berkeley segmentation database. The top figure highlights in red the boundaries of the clusters in the first layer ℬ1 after dissolving clusters of size smaller than 26. The bottom figure is the same but for layer two ℬ2. This figure highlights the limitations of the correspondence between clusters and image segments at the present stage.

