
Figure 2. Changes in SST interneuron afferent connectivity do not result from changes in the L5/6 population.
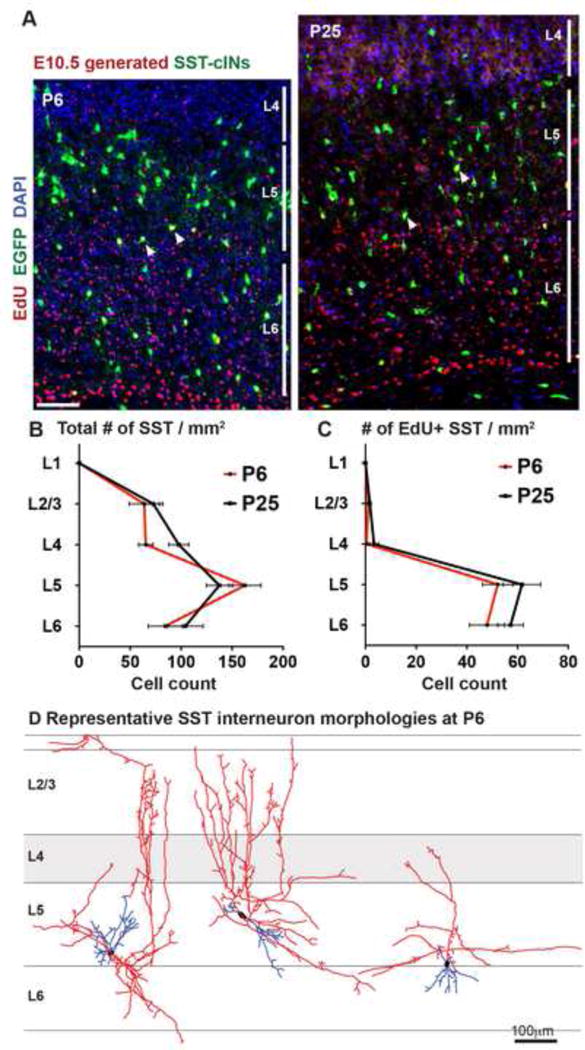
(A) Genetically labeled SST interneurons born at E10.5 are saturation labelled with EdU and the number of SST interneurons were assessed at P6 (left) and and P25 (right). (B) The density of EGFP+ SST interneurons in per mm2 of each layer within infragranular layers of S1BC does not change when normalized to the brain volume at P6 and P25 (p>0.05) (C) The number of SST interneurons generated at E10.5 (EdU+EGFP+ doubled labeled cells) at P6 were not significantly different compared to P25 (p>0.05). n=3 animals, n ≥ 3 sections were analyzed per animal, mean ± SEM, two-sample t-test, scale bars 50μm, see also Figure S2. (D) Exemplary SST interneuron reconstructions at P6 obtained by diluted EnvA+RVdG-mCh injections into SSTCRE; Rosa-TVA mice displays heterogeneous morphological arborizations.