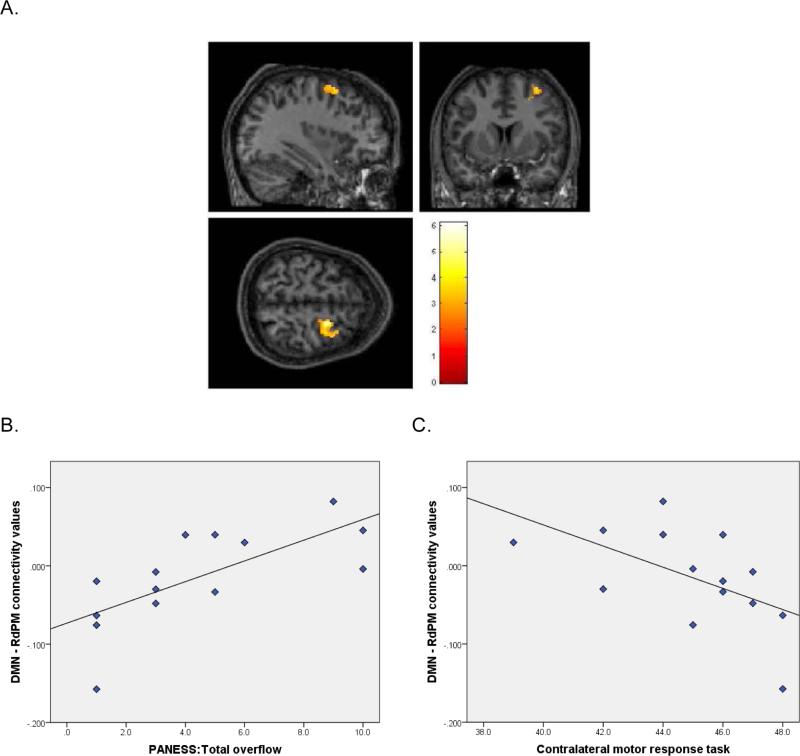
Figure 1. DMN-RdPM Connectivity and Correlation with motor control.
A. Sectional maps showing the DMN-RdPM region where between-group rs-fMRI analyses indicated children with TBI had significantly greater IC than CONTROLS. B. Plot of the correlation between connectivity values derived from the DMN-RdPM region and PANESS total overflow scores in children with TBI. C. Plot of the correlation between connectivity values derived from the DMN-RdPM region and Contralateral MRT scores in children with TBI.

